|
Nuclear Medicine: Cancer: Bone Scans:
Bone
Scan Quantitative Parameters
Significance
for the Evaluation of Survival Rate in Prostate Cancer Patients
by
Dr. Nayab Mustansar, Consultant Nuclear Physician
Pakistan Atomic
Energy Commission
Islamabad, Pakistan
|
|
|
ABSTRACT
Prostate
Cancer is one of the common cancers in the world. It could primarily
disseminate to the bone and can lead to death. In order to address its life
threatening distant metastasis it is important to diagnose it earlier for timely
treatment. Bone metastasis is usually diagnosed deploying bone scan imaging.
However interpretation of the bone scans is a tedious procedure for the
physicians and often leads to misinterpretation either as overestimation or
underestimation of the metastasis. To minimize the risk of misinterpretation,
one of the accurate methods is quantitative analysis of the bone scans in order
to ascertain, whether a metastatic lesion is present or not. There are several
methods to-date which can be used to analyse the extent of such lesions. For
example, quantitation of the bone scan using quantitation methods i-e % BSI
(Bone scan index), % PAB (Positive area on bone scans), EOD (extent of disease)
and BLS (Bone lesion scoring). These methods are used for prognostication of
survival and response to treatment on serial scans. The extent of fidelity of
these all available quantitatation methods is not clear when used altogether in
a single baseline bone scan. Therefore, the aim of this study is to use all
available bone scan quantitative parameters on a baseline bone scans and to
compare them all. Moreover, an improved methodology is introduced by comparing
the results with the individual methods reported in literature and with PSA
levels.
141
patients with histopathologically proved prostate cancer were chosen to
implement all the four quantitative parameters on individual baseline bone
scans. After which, for the calculation of risk of progression or regression of
disease and survival rate, 40 patients were chosen from the same dataset. A
serial follow up scan was performed to calculate 2-years survival rate. The
dataset was again analysed using the same four bone scan quantitative
parameters and the cut off were calculated as % BSI: 1, % PAB:
0.5, EOD: grade 0 & 1, grade2, 3 & 4 and BLS: 5.
It
was found out that the %PAB and % BSI methods are good prognostic indicator in
baseline scans. Moreover the prostate cancer patients with the cut off % BSI
>1, %PAB > 0.5, BLS >5 and EOD with grade 2, 3 & 4 showed increase
risk of disease progression and less survival.
ABBREVIATIONS
MDP-
Methyl-Di-phosphonate
PET-
Positron Emission Tomography
SPECT-
Single Photon Emission Computed Tomography
BSI-
Bone Scan Index
BLS-Bone
Lesion Scoring
EOD-Extent
of Disease
PAB-
Positive area on Bone Scan
PSA-Prostate
Specific Antigen
CT-
Computed Tomography
MRI-Magnetic
Resonance Imaging
USG-Ultra
Sonography
EBRT-External
Beam Radiation Therapy
1
INTRODUCTION
1.1
The Skeleton
The
adult human skeleton has a total of 213 bones, excluding the sesamoid bones.
The appendicular skeleton has 126 bones, axial skeleton 74 bones, and auditory
ossicles six bones. Each bone constantly undergoes modelling during life to
help it adapt to changing biomechanical forces, as well as remodelling to remove
old, microdamaged bone and replace it with new, mechanically stronger bone to
help preserve bone strength [[1]].
The
four general categories of bones are long bones, short bones, flat bones, and
irregular bones. Long bones include the clavicles, humeri, radii, ulnae,
metacarpals, femurs, tibiae, fibulae, metatarsals, and phalanges. Short bones
include the carpal and tarsal bones, patellae, and sesamoid bones. Flat bones
include the skull, mandible, scapulae, sternum, and ribs. Irregular bones
include the vertebrae, sacrum, coccyx, and hyoid bone. Flat bones form by
membranous bone formation, whereas long bones are formed by a combination of
endochondral and membranous bone formation.
The
skeleton serves a variety of functions. The bones of the skeleton provide
structural support for the rest of the body, permit movement and locomotion by
providing levers for the muscles, protect vital internal organs and structures,
provide maintenance of mineral homeostasis and acid-base balance, serve as a
reservoir of growth factors and cytokines, and provide the environment for
haematopoiesis within the marrow spaces [[2]].
The
long bones are composed of a hollow shaft, or diaphysis; flared, cone-shaped
metaphyses below the growth plates; and rounded epiphyses above the growth
plates. The diaphysis is composed primarily of dense cortical bone, whereas the
metaphysis and epiphysis are composed of trabecular meshwork bone surrounded by
a relatively thin shell of dense cortical bone.
The
adult human skeleton is composed of 80% cortical bone and 20% trabecular bone
overall. Different bones and skeletal sites within bones have different ratios
of cortical to trabecular bone. The vertebra is composed of cortical to
trabecular bone in a ratio of 25:75. This ratio is 50:50 in the femoral head
and 95:5 in the radial diaphysis.
Cortical
bone is dense and solid and surrounds the marrow space, whereas trabecular bone
is composed of a honeycomb-like network of trabecular plates and rods
interspersed in the bone marrow compartment. Both cortical and trabecular bone
are composed of osteons [[3]].
Cortical
osteons are called Haversian systems. Haversian systems are cylindrical in
shape, are approximately 400 mm long and 200 mm wide at their base, and form a
branching network within the cortical bone. The walls of Haversian systems are
formed of concentric lamellae. Cortical bone is typically less metabolically
active than trabecular bone, but this depends on the species. There are an
estimated 21 × 106 cortical osteons in healthy human adults, with a
total Haversian remodelling area of approximately 3.5 m2. Cortical
bone porosity is usually <5%, but this depends on the proportion of actively
remodelling Haversian systems to inactive cortical osteons. Increased cortical
remodelling causes an increase in cortical porosity and decrease in cortical
bone mass. Healthy aging adults normally experience thinning of the cortex and
increased cortical porosity [[4]].
Cortical
bone has an outer periosteal surface and inner endosteal surface. Periosteal
surface activity is important for appositional growth and fracture repair. Bone
formation typically exceeds bone resorption on the periosteal surface, so bones
normally increase in diameter with aging. The endosteal surface has a total
area of approximately 0.5 m2, with higher remodelling activity than
the periosteal surface, likely as a result of greater biomechanical strain or
greater cytokine exposure from the adjacent bone marrow compartment. Bone
resorption typically exceeds bone formation on the endosteal surface, so the
marrow space normally expands with aging [[5]].
Trabecular
osteons are called packets. Trabecular bone is composed of plates and rods
averaging 50 to 400 mm in thickness. Trabecular osteons are semilunar in shape,
normally approximately 35 mm thick, and composed of concentric lamellae. It is
estimated that there are 14 × 106 trabecular osteons in healthy
human adults, with a total trabecular area of approximately 7 m2.
Cortical
bone and trabecular bone are normally formed in a lamellar pattern, in which
collagen fibrils are laid down in alternating orientations. Lamellar bone is
best seen during microscopic examination with polarized light, during which the
lamellar pattern is evident as a result of birefringence. The mechanism by
which osteoblasts lay down collagen fibrils in a lamellar pattern is not known,
but lamellar bone has significant strength as a result of the alternating
orientations of collagen fibrils, similar to plywood. The normal lamellar
pattern is absent in woven bone, in which the collagen fibrils are laid down in
a disorganized manner. Woven bone is weaker than lamellar bone. Woven bone is
normally produced during formation of primary bone and may also be seen in high
bone turnover states such as osteitis fibrosa cystica, as a result of
hyperparathyroidism, and Paget's disease or during high bone formation during
early treatment with fluoride [[6]].
The
periosteum is a fibrous connective tissue sheath that surrounds the outer
cortical surface of bone, except at joints where bone is lined by articular
cartilage, which contains blood vessels, nerve fibers, and osteoblasts and
osteoclasts. The periosteum is tightly attached to the outer cortical surface
of bone by thick collagenous fibers, called Sharpeys’ fibers, which extend into
underlying bone tissue. The endosteum is a membranous structure covering the
inner surface of cortical bone, trabecular bone, and the blood vessel canals
(Volkmann’s canals) present in bone. The endosteum is in contact with the bone
marrow space, trabecular bone, and blood vessel canals and contains blood
vessels, osteoblasts, and osteoclasts [[7]].
1.2
Bone Growth Modeling and Remodeling
Bone
undergoes longitudinal and radial growth, modelling, and remodelling during
life. Longitudinal and radial growth during growth and development occurs
during childhood and adolescence. Longitudinal growth occurs at the growth
plates, where cartilage proliferates in the epiphyseal and metaphyseal areas of
long bones, before subsequently undergoing mineralization to form primary new bone
[[8]].
Modelling
is the process by which bones change their overall shape in response to
physiologic influences or mechanical forces, leading to gradual adjustment of
the skeleton to the forces that it encounters. Bones may widen or change axis
by removal or addition of bone to the appropriate surfaces by independent
action of osteoblasts and osteoclasts in response to biomechanical forces.
Bones normally widen with aging in response to periosteal apposition of new
bone and endosteal resorption of old bone. Wolff's law describes the
observation that long bones change shape to accommodate stresses placed on
them. During bone modelling, bone formation and resorption are not tightly
coupled. Bone modelling is less frequent than remodelling in adults. Modelling
may be increased in hyporparathyroidism, renal osteodystrophy or treatment with
anabolic agents [[9]].
Bone
remodelling is the process by which bone is renewed to maintain bone strength
and mineral homeostasis. Remodelling involves continuous removal of discrete
packets of old bone, replacement of these packets with newly synthesized
proteinaceous matrix, and subsequent mineralization of the matrix to form new
bone. The remodelling process resorbs old bone and forms new bone to prevent
accumulation of bone microdamage. Remodelling begins before birth and continues
until death. The bone remodelling unit is composed of a tightly coupled group
of osteoclasts and osteoblasts that sequentially carry out resorption of old
bone and formation of new bone. Bone remodelling increases in perimenopausal
and early postmenopausal women and then slows with further aging, but continues
at a faster rate than in premenopausal women. Bone remodelling is thought to
increase mildly in aging men.
The
remodelling cycle is composed of four sequential phases. Activation precedes
resorption, which precedes reversal, which precedes formation. Remodelling
sites may develop randomly but also are targeted to areas that require repair
[8, 9]. Remodelling sites are thought to develop mostly in a random manner.
Activation
involves recruitment and activation of mononuclear monocyte-macrophage
osteoclast precursors from the circulation , lifting of the endosteum that
contains the lining cells off the bone surface, and fusion of multiple mononuclear
cells to form multinucleated preosteoclasts. Preosteoclasts bind to bone matrix
via interactions between integrin receptors in their cell membranes and
RGD (arginine, glycine, and asparagine)-containing peptides in matrix proteins,
to form annular sealing zones around bone-resorbing compartments beneath
multinucleated osteoclasts [[10]].
Osteoclast-mediated
bone resorption takes only approximately 2 to 4 wk during each remodelling
cycle [[11]].
Osteoclast formation, activation, and resorption are regulated by the ratio of
receptor activator of NF-κB ligand (RANKL) to osteoprotegerin (OPG), IL-1
and IL-6, colony-stimulating factor (CSF), parathyroid hormone,
1,25-dihydroxyvitamin D, and calcitonin [[12]].
Resorbing osteoclasts secrete hydrogen ions via H+-ATPase proton
pumps and chloride channels in their cell membranes into the resorbing
compartment to lower the pH within the bone-resorbing compartment to as low as
4.5, which helps mobilize bone mineral [[13]].
Resorbing osteoclasts secrete tartrate-resistant acid phosphatase, cathepsin K,
matrix metalloproteinase 9, and gelatinase from cytoplasmic lysosomes to digest
the organic matrix, resulting in formation of saucer-shaped Howship's lacunae
on the surface of trabecular bone and Haversian canals in cortical bone. The
resorption phase is completed by mononuclear cells after the multinucleated
osteoclasts undergo apoptosis [[14]].
Regulation
of osteoclastogenesis by receptor activator of NF-κB ligand (RANKL) and
osteoprotegerin (OPG): Colony-stimulating factor 1 (CSF-1) normally stimulates
osteoclast recruitment. Two forms of RANKL are produced by osteoblasts and
osteoblast [[15]].
Multinucleated osteoclasts resorb bone to
form resorption pits known as Howship's lacunae [[16]].During the
reversal phase, bone resorption transitions to bone formation. At the
completion of bone resorption, resorption cavities contain a variety of
mononuclear cells, including monocytes, osteocytes released from bone matrix,
and preosteoblasts recruited to begin new bone formation. The coupling signals
linking the end of bone resorption to the beginning of bone formation are as
yet unknown. Proposed coupling signal candidates include bone matrix—derived
factors such as TGF-β, IGF-1, IGF-2, bone morphogenetic proteins, PDGF, or
fibroblast growth factor [[17]].
TGF-β concentration in bone matrix correlates with histomorphometric
indices of bone turnover and with serum osteocalcin and bone-specific alkaline
phosphatase [[18]].
TGF-β released from bone matrix decreases osteoclast resorption by
inhibiting RANKL production by osteoblasts. The reversal phase has also been
proposed to be mediated by the strain gradient in the lacunae. As osteoclasts
resorb cortical bone in a cutting cone, strain is reduced in front and
increased behind, and in Howship's lacunae, strain is highest at the base and
less in surrounding bone at the edges of the lacunae. The strain gradient may
lead to sequential activation of osteoclasts and osteoblasts, with osteoclasts
activated by reduced strain and osteoblasts by increased strain. The osteoclast
itself has also been proposed to play a role during reversal [[19]].
Bone
formation takes approximately 4 to 6 mo to complete. Osteoblasts synthesize new
collagenous organic matrix and regulate mineralization of matrix by releasing
small, membrane-bound matrix vesicles that concentrate calcium and phosphate
and enzymatically destroy mineralization inhibitors such as pyrophosphate or
proteoglycans. Osteoblasts surrounded by and buried within matrix become
osteocytes with an extensive canalicular network connecting them to bone
surface lining cells, osteoblasts, and other osteocytes, maintained by gap
junctions between the cytoplasmic processes extending from the osteocytes. The
osteocyte network within bone serves as a functional syncytium. At the
completion of bone formation, approximately 50 to 70% of osteoblasts undergo
apoptosis, with the balance becoming osteocytes or bone-lining cells.
Bone-lining cells may regulate influx and efflux of mineral ions into and out
of bone extracellular fluid, thereby serving as a blood-bone barrier, but
retain the ability to redifferentiate into osteoblasts upon exposure to
parathyroid hormone or mechanical forces [[20]].
Bone-lining cells within the endosteum lift off the surface of bone before bone
resorption to form discrete bone remodeling compartments with a specialized
microenvironment. In patients with multiple myeloma, lining cells may be
induced to express tartrate-resistant acid phosphatase and other classical
osteoclast markers [[21]].
The
end result of each bone remodeling cycle is production of a new osteon. The
remodeling process is essentially the same in cortical and trabecular bone,
with bone remodeling units in trabecular bone equivalent to cortical bone
remodeling units divided in half longitudinally. Bone balance is the difference
between the old bone resorbed and new bone formed. Periosteal bone balance is
mildly positive, whereas endosteal and trabecular bone balances are mildly
negative, leading to cortical and trabecular thinning with aging. These
relative changes occur with endosteal resorption outstripping periosteal
formation [[22]].
The
main recognized functions of bone remodeling include preservation of bone
mechanical strength by replacing older, microdamaged bone with newer, healthier
bone and calcium and phosphate homeostasis. The relatively low adult cortical
bone turnover rate of 2 to 3%/yr is adequate to maintain biomechanical strength
of bone. The rate of trabecular bone turnover is higher, more than required for
maintenance of mechanical strength, indicating that trabecular bone turnover is
more important for mineral metabolism. Increased demand for calcium or
phosphorus may require increased bone remodeling units, but, in many cases,
this demand may be met by increased activity of existing osteoclasts. Increased
demand for skeletal calcium and phosphorus is met partially by osteoclastic
resorption and partly by nonosteoclastic calcium influx and efflux. Ongoing
bone remodelling activity ensures a continuous supply of newly formed bone that
has relatively low mineral content and is able to exchange ions more easily
with the extracellular fluid. Bone remodeling units seem to be mostly randomly
distributed throughout the skeleton but may be triggered by microcrack
formation or osteocyte apoptosis. The bone remodeling space represents the sum
of all of the active bone remodeling units in the skeleton at a given time [[23]].
1.2.1
Osteoclasts
Osteoclasts
are the only cells that are known to be capable of resorbing bone. Activated
multinucleated osteoclasts are derived from mononuclear precursor cells of the
monocyte-macrophage lineage. Mononuclear monocyte-macrophage precursor cells
have been identified in various tissues, but bone marrow monocyte-macrophage
precursor cells are thought to give rise to most osteoclasts.
RANKL
and macrophage CSF (M-CSF) are two cytokines that are critical for osteoclast
formation. Both RANKL and M-CSF are produced mainly by marrow stromal cells and
osteoblasts in membrane-bound and soluble forms, and osteoclastogenesis
requires the presence of stromal cells and osteoblasts in bone marrow [[24]]. RANKL
belongs to the TNF superfamily and is critical for osteoclast formation. M-CSF
is required for the proliferation, survival, and differentiation of osteoclast
precursors, as well as osteoclast survival and cytoskeletal rearrangement
required for bone resorption. OPG is a membrane-bound and secreted protein that
binds RANKL with high affinity to inhibit its action at the RANK receptor.
Bone
resorption depends on osteoclast secretion of hydrogen ions and cathepsin K
enzyme. H+ ions acidify the resorption compartment beneath osteoclasts
to dissolve the mineral component of bone matrix, whereas cathepsin K digests
the proteinaceous matrix, which is mostly composed of type I collagen [[25]].
Osteoclasts
bind to bone matrix via integrin receptors in the osteoclast membrane
linking to bone matrix peptides. The β1 family of integrin receptors in
osteoclasts binds to collagen, fibronectin, and laminin, but the main integrin
receptor facilitating bone resorption is the αvβ3
integrin, which binds to osteopontin and bone sialoprotein.
Binding
of osteoclasts to bone matrix causes them to become polarized, with the bone
resorbing surface developing a ruffled border that forms when acidified
vesicles that contain matrix metalloproteinases and cathepsin K are transported
via microtubules to fuse with the membrane. The ruffled border secretes
H+ ions via H+-ATPase and chloride channels and
causes exocytosis of cathepsin K and other enzymes in the acidified vesicles [[26]].
Upon
contact with bone matrix, the fibrillar actin cytoskeleton of the osteoclast
organizes into an actin ring, which promotes formation of the sealing zone
around the periphery of osteoclast attachment to the matrix. The sealing zone
surrounds and isolates the acidified resorption compartment from the
surrounding bone surface . Disruption of either the ruffled border or actin
ring blocks bone resorption. Actively resorbing osteoclasts form podosomes,
which attach to bone matrix, rather than focal adhesions as formed by most
cells. Podosomes are composed of an actin core surrounded by αvβ3
integrins and associated cytoskeletal proteins [[27]].
1.2.2
Osteoblasts
Osteoprogenitor
cells give rise to and maintain the osteoblasts that synthesize new bone matrix
on bone-forming surfaces, the osteocytes within bone matrix that support bone
structure, and the protective lining cells that cover the surface of quiescent
bone. Within the osteoblast lineage, subpopulations of cells respond
differently to various hormonal, mechanical, or cytokine signals. Osteoblasts
from axial and appendicular bone have been shown to respond differently to
these signals.
Self-renewing,
pluripotent stem cells give rise to osteoprogenitor cells in various tissues
under the right environmental conditions. Bone marrow contains a small
population of mesenchymal stem cells that are capable of giving rise to bone,
cartilage, fat, or fibrous connective tissue, distinct from the hematopoietic
stem cell population that gives rise to blood cell lineages [[28]]. Cells with
properties that are characteristic of adult bone marrow mesenchymal stem cells
have been isolated from adult peripheral blood and tooth pulp and fetal cord
blood, liver, blood, and bone marrow. Multipotential myogenic cells that are
capable of differentiating into bone, muscle, or adipocytes have also been
identified. Mesenchymal cells that are committed to one phenotype may
dedifferentiate during proliferation and develop another phenotype, depending
on the local tissue environment. Blood vessel pericytes may develop an
osteoblastic phenotype during dedifferentiation under the right circumstances [[29]].
Commitment
of mesenchymal stem cells to the osteoblast lineage requires the canonical
Wnt/β-catenin pathway and associated proteins. Identification of a high
bone mass phenotype associated with activating mutations of LDL
receptor–related protein 5 highlighted the importance of the canonical
Wnt/β-catenin pathway in embryonic skeletal patterning, fetal skeletal
development, and adult skeletal remodeling . The Wnt system is also important
in chondrogenesis and hematopoiesis and may be stimulatory or inhibitory at
different stages of osteoblast differentiation [[30]].
Flattened
bone-lining cells are thought to be quiescent osteoblasts that form the
endosteum on trabecular and endosteal surfaces and underlie the periosteum on
the mineralized surface. Osteoblasts and lining cells are found in close
proximity and joined by adherens junctions. Cadherins are calcium-dependent
transmembrane proteins that are integral parts of adherens junctions and
together with tight junctions and desmosomes join cells together by linking
their cytoskeletons [[31]].
Osteoblast
precursors change shape from spindle-shaped osteoprogenitors to large cuboidal
differentiated osteoblasts on bone matrix surfaces after preosteoblasts stop
proliferating. Preosteoblasts that are found near functioning osteoblasts in
the bone remodeling unit are usually recognizable because of their expression
of alkaline phosphatase. Active mature osteoblasts that synthesize bone matrix
have large nuclei, enlarged Golgi structures, and extensive endoplasmic
reticulum. These osteoblasts secrete type I collagen and other matrix proteins
vectorially toward the bone formation surface.
Populations
of osteoblasts are heterogeneous, with different osteoblasts expressing
different gene repertoires that may explain the heterogeneity of trabecular
microarchitecture at different skeletal sites, anatomic site-specific
differences in disease states, and regional variation in the ability of
osteoblasts to respond to agents used to treat bone disease [[32]].
1.2.3
Osteocytes
Osteocytes
represent terminally differentiated osteoblasts and function within syncytial
networks to support bone structure and metabolism. Osteocytes lie within
lacunae within mineralized bone and have extensive filipodial processes that
lie within the canaliculi in mineralized bone . Osteocytes do not normally
express alkaline phosphatase but do express osteocalcin, galectin 3, and CD44,
a cell adhesion receptor for hyaluronate, as well as several other bone matrix
proteins. Osteocytes express several matrix proteins that support intercellular
adhesion and regulate exchange of mineral in the bone fluid within lacunae and
the canalicular network. Osteocytes are active during osteolysis and may
function as phagocytic cells because they contain lysosomes [[33]].
Osteocytes
maintain connection with each other and the bone surface via their
multiple filipodial cellular processes. Connexins are integral cellular
proteins that maintain gap junctions between cells to allow direct
communication through intercellular channels. Osteocytes are linked
metabolically and electrically through gap junctions composed primarily of
connexin 43. Gap junctions are required for osteocyte maturation, activity, and
survival.
The
primary function of the osteocyte-osteoblast/lining cell syncytium is mechanosensation.
Osteocytes transduce stress signals from bending or stretching of bone into
biologic activity. Flow of canalicular fluid in response to external forces
induces a variety of responses within osteocytes. Rapid fluxes of bone calcium
across filipodial gap junctions are believed to stimulate transmission of
information between osteoblasts on the bone surface and osteocytes within the
bone [[34]].
Signaling mechanisms involved in mechanotransduction include prostaglandin E2,
cyclo-oxygenase 2, various kinases, Runx2, and nitrous oxide.
Osteocytes
may live for decades in human bone that is not turned over. The presence of
empty lacunae in aging bone suggests that osteocytes may undergo apoptosis,
probably caused by disruption of their intercellular gap junctions or
cell–matrix interactions. Osteocyte apoptosis in response to estrogen
deficiency or glucocorticoid treatment is harmful to bone structure. Estrogen
and bisphosphonate therapy and physiologic loading of bone may help prevent
osteoblast and osteocyte apoptosis [[35]].
1.3
Bone Extracellular Matrix
Bone
protein is composed of 85 to 90% collagenous proteins. Bone matrix is mostly
composed of type I collagen with trace amounts of types III and V and FACIT
collagens at certain stages of bone formation that may help determine collagen
fibril diameter. FACIT collagens are members of the family of Fibril-Associated
Collagens with Interrupted Triple Helices, a group of nonfibrillar collagens
that serve as molecular bridges that are important for the organization and
stability of extracellular matrices. Members of this family include collagens
IX, XII, XIV, XIX, XX, and XXI. Noncollagenous proteins compose 10 to 15% of
total bone protein. Approximately 25% of noncollagenous protein is exogenously
derived, including serum albumin and α2-HS-glycoprotein, which bind to
hydroxyapatite because of their acidic properties. Serum-derived noncollagenous
proteins may help regulate matrix mineralization, and α2-HS-glycoprotein,
which is the human analogue of fetuin, may regulate bone cell proliferation.
The remaining exogenously derived noncollagenous proteins are composed of
growth factors and a large variety of other molecules in trace amounts that may
affect bone cell activity [[36]].
Osteoblasts
synthesize and secrete as much noncollagenous protein as collagen on a molar
basis. The noncollagenous proteins are divided broadly into several categories,
including proteoglycans, glycosylated proteins, glycosylated proteins with
potential cell-attachment activities, and γ-carboxylated (gla) proteins.
The roles of each of the bone proteins are not well defined at present, and
many seem to serve multiple functions, including regulation of bone mineral
deposition and turnover and regulation of bone cell activity. Serum osteocalcin
synthesized by osteoblasts was previously thought to function as a promoter or
initiator of calcium deposition at the nidus between the ends of collagen
fibrils and therefore regarded as a marker of bone formation. The observation
that the osteocalcin knockout mouse has a high bone mass phenotype suggests
that osteocalcin normally inhibits bone formation. Because serum osteocalcin is
derived from both matrix release by osteoclast activity and osteoblast
synthesis, it is currently regarded as a marker of bone turnover rather than a
specific marker of bone formation.
The
main glycosylated protein present in bone is alkaline phosphatase. Alkaline
phosphatase in bone is bound to osteoblast cell surfaces via a
phosphoinositol linkage and also is found free within mineralized matrix.
Alkaline phosphatase plays an as-yet-undefined role in mineralization of bone [[37]]. The most
prevalent noncollagenous protein in bone is osteonectin, accounting for
approximately 2% of total protein in developing bone. Osteonectin is thought to
affect osteoblast growth and/or proliferation and matrix mineralization.
1.4
Bone Matrix Mineralization
Bone
is composed of 50 to 70% mineral, 20 to 40% organic matrix, 5 to 10% water, and
<3% lipids. The mineral content of bone is mostly hydroxyapatite [Ca10(PO4)6(OH)2],
with small amounts of carbonate, magnesium, and acid phosphate, with missing
hydroxyl groups that are normally present. Compared with geologic
hydroxyapatite crystals, bone hydroxyapatite crystals are very small, measuring
only approximately 200 Å in their largest dimension. These small, poorly
crystalline, carbonate-substituted crystals are more soluble than geologic
hydroxyapatite crystals, thereby allowing them to support mineral metabolism [[38]].
Matrix
maturation is associated with expression of alkaline phosphatase and several
noncollagenous proteins, including osteocalcin, osteopontin, and bone
sialoprotein. It is thought that these calcium- and phosphate-binding proteins
help regulate ordered deposition of mineral by regulating the amount and size
of hydroxyapatite crystals formed.
Bone
mineral provides mechanical rigidity and load-bearing strength to bone, whereas
the organic matrix provides elasticity and flexibility. Bone mineral is
initially deposited in “hole” zones between the ends of collagen fibrils. This
process may be facilitated by extracellular matrix vesicles in bone, as it is
in calcifying cartilage and mineralizing turkey tendon. Matrix extracellular
vesicles are synthesized by chondrocytes and osteoblasts and serve as protected
microenvironments in which calcium and phosphate concentrations can increase
sufficiently to precipitate crystal formation. The extracellular fluid is not
normally supersaturated with hydroxyapatite, so hydroxyapatite does not
spontaneously precipitate. Matrix extracellular vesicles contain a nucleational
core that is composed of proteins and a complex of acidic phospholipids,
calcium, and inorganic phosphate that is sufficient to precipitate
hydroxyapatite crystals. It is not yet certain how matrix extracellular
vesicles contribute to mineralization at specific sites at the ends of collagen
fibrils, because the vesicles apparently are not directly targeted to the ends
of fibrils [[39]].
There
is no evidence that noncrystalline calcium phosphate clusters (amorphous
calcium phosphate) forms in bone before it is converted to hydroxyapatite. As
bone matures, hydroxyapatite crystals enlarge and reduce their level of
impurities. Crystal enlargement occurs both by crystal growth and by
aggregation. Bone matrix macromolecules may facilitate initial crystal
nucleation, sequester mineral ions to increase local concentrations of calcium
and/or phosphorus, or facilitate heterogeneous nucleation. Macromolecules also
bind to growing crystal surfaces to determine the size, shape, and number of
crystals formed.
Confirmed
mineralization promoters (nucleators) include dentin matrix protein 1 and bone
sialoprotein. Type I collagen is not a bone mineralization promoter.
Phosphoprotein kinases and alkaline phosphatase regulate the mineralization
process. Bone alkaline phosphatase may increase local phosphorus
concentrations, remove phosphate-containing inhibitors of hydroxyapatite
crystal growth, or modify phosphoproteins to control their ability to act as
nucleators [[40]].
Vitamin
D plays in an indirect role in stimulating mineralisation of unminearlised bone
matrix. After absorption or skin production of Vitamin D, the liver synthesises
25-hydroxyvitmain D and kidney subsequently produces biologically active 1, 25
dihydroxyvitamin D. Which is responsible for maintaining serum calcium and
phosphorous in adequate concentration to allow passive mineralization of the
unmineralised matrix. Serum 1, 25-(OH)2D does this primarily by
stimulating intestinal absorption of calcium and phosphorus. Serum 1,25-(OH)2D
also promotes differentiation of osteoblasts and stimulates osteoblastic
expression of bone-specific alkaline phosphatase, osteocalcin, osteonectin,
OPG, and a variety of other cytokines. Serum 1,25-(OH)2D also
influences proliferation and apoptosis of other skeletal cells, including
hypertrophic chondrocytes
[[41]].
1.5
Determinants of Bone Strength
Bone
mass accounts for 50 to 70% of bone strength. Bone geometry and composition are
important, however, because larger bones are stronger than smaller bones, even
with equivalent bone mineral density. As bone diameter expands radially, the
strength of bone increases by the radius of the involved bone raised to the
fourth power. The amount and proportion of trabecular and cortical bone at a given
skeletal site affect bone strength independently. Bone material properties are
important for bone strength. Some patients with osteoporosis have abnormal bone
matrix. Mutations in certain proteins may cause bone weakness (e.g.,
collagen defects cause decreased bone strength in osteogenesis imperfecta,
impaired γ-carboxylation of Gla proteins). Bone strength can be affected
by osteomalacia, fluoride therapy, or hypermineralization states. Bone
microstructure affects bone strength also. Low bone turnover leads to accumulation
of microfractures. High bone turnover, with bone resorption greater than bone
formation, is the main cause of microarchitectural deterioration [[42]].
1.6
Bone Tumours
Bone
tumours develop when cell in the bone divide without control, forming a mass of
tissue. Most bone tissues are benign and they don’t spread. However they may
still weaken bone and can lead to fracture and cause other problems. Bone
cancers may destroy normal bone tissues and can spread to other parts of the
body called as metastasis.
1.6.1
Benign Bone Tumors
They
are more common than the malignant tumours. Following are the most common
benign tumours.
Ø Osteochondroma
Ø
Osteoid
Osteoma
Ø
Giant
cell Tumour
Ø
Osteoblastoma
Ø Enchondroma
1.6.2
Metastatic Cancer
The
metastatic bone cancer is the one in which primary is present somewhere else in
the body whereas it metastasize to bone. Even though it spreads to the bone it
is not considered as the bone tumour because the primary is present elsewhere.
Cancers that commonly spread to the bones are:
Ø Breast
Cancer
Ø
Prostate
Cancer
Ø Lung
Cancer
The axial skeleton, the
primary site of active marrow, is the most common distribution of metastatic spread
for patients with prostate cancer. At this time, there is no standard means by
which osseous lesions can be directly visualized or quantified; thus, there is no
qualified imaging biomarker for prostate cancer. Bone scintigraphy is commonly
used to assess disease burden and treatment effects, but it is an imperfect
modality for quantifying disease or for demonstrating treatment effects. Bone
scans do not specifically identify cancer, can paradoxically worsen in the face
of response (“flare”), and frequently improve only slowly if at all, despite
patients ‘receiving active treatments [[43]].
The skeleton
is the most common organ to be affected by metastatic cancer and the site of
disease that produces the greatest morbidity. Skeletal morbidity includes pain
that requires radiotherapy, hypercalcemia, pathological fracture, and spinal
cord or even nerve root compression. From randomised trials in advanced cancer,
it can be seen that one of these major skeletal events occur on an average
every 3-6 months. Additionally, metastatic disease may remain confined to the
skeleton with the decline in quality of life and eventual death almost entirely
due to skeletal complication and their treatment. The prognosis of metastatic
bone disease is dependent on the primary site with the breast and prostate
cancer associated with a survival measured in years compared with lung cancer,
where average survival is only a matter of months. Additionally, the presence
of extraosseous disease and the extent and tempo of the bone disease are
powerful predictors of outcome. The latter is best estimated by measurement of
bone-specific-markers, and recent studies have shown a strong correlation
between the rate of bone resorption and clinical outcome, both in terms of
skeletal morbidity and progression of the underlying disease [[44]].
Bone
is the third most common site for the metastatic cancer after lung and liver
cancer .It is estimated that skeletal metastasis develops in 14-70% of all the
tumour patients and autopsy based studies report the occurrence in 70% patients
with carcinoma Breast and Prostate. In addition to ca prostate and ca prostate,
many other tumours like lung, thyroid, kidney and melanoma have predilection
for skeletal metastasis.From all the randomised trials in advanced cancer, it
is estimated that one of these major skeletal events occurs on average every
3-6 months [[45]].
Table 1.1:
Incidence of bone metastasis, Prevalence and Survival. [[46]]
|
Primary Tumour
|
Incidence of Bone Metastasis
|
Incidence of Bone Metastasis
in Advanced Disease (At Autopsy)
|
Median Time of Survival
after Diagnosis of Bone metastasis
|
Five Year World Prevalence
|
|
Breast
|
73
|
65-75%
|
19-25 months
|
3,860,000
|
|
Prostate
|
68
|
65-75%
|
12-53 months
|
1,555,000
|
|
Thyroid
|
42
|
60%
|
48 months
|
475,000
|
|
Kidney
|
20-25
|
|
6 months
|
480,000
|
|
Lung
|
36
|
30-40%
|
7 months
|
1,394,000
|
|
GIT
|
5
|
|
|
|
|
Myeloma
|
|
70-95%
|
6-54 months
|
144,000
|
|
Melanoma
|
|
14-45%
|
6 months
|
533,000
|
Vertebrae
are most frequently involved (L>T>S>C). 38% of the metastatic disease
involves the Thoraco-lumbar spine. Other bones involved in the order of the
decreasing frequent are Pelvis, Ribs ,Sternum ,femur, humerus, Skull and hands.
Ca Prostate specifically involves spine, femur, pelvis, skull, ribs and sternum
while the one in breast carcinoma involves spine, pelvis, proximal femur,
skull, ribs and mid-humerus. Each year thousands of cancer patients develop
bone metastasis. In USA 7100,000 such new patients have been registered. This
number is higher in the developing countries because most of the patients are
diagnosed with locally advanced or metastatic stage of the disease that are
already at increased risk of dissemination and bone metastasis.
Bone
metastasis is clinically very important in prostate and breast cancer because
of the prevalence of these diseases. By worldwide screening used worldwide e-g
PSA levels for the prostate cancer and mammography for the breast cancer [[47]].
Benign
and Malignant Bone Disease: [[48]]
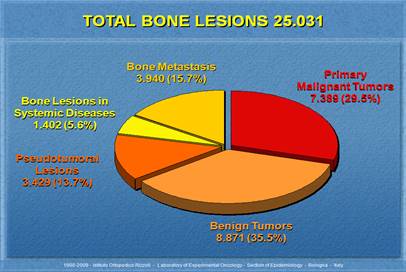
Figure 1.1:
Benign and Malignant Cancers Percentage [48]
1.7
Pathophysiology of Osseous Metastasis
Bone
mainly consists of inorganic and organic part. 69% of the bone is composed of
inorganic mineral part hydroxyapatite Ca10 (PO4)6(OH)2
and other mineral salts like amorphous Ca3(PO4)2
, 22% is organic matrix with 90% collagen and 10% non collagenous
proteins and rest of 9% is water.
The
Pathophysiology of bone metastasis and related complication is complex. Two
facts likely increase the tumour seeding in bones. First is that the metastasis
usually occurs in the axial skeleton due to sluggish blood flow in the red
marrow which is abundant in the axial skeleton. Secondly, venous blood flows
though the vertebral venous plexus of Batson [[49]].Skeletal
metastasis is multifactorial process with complex interaction between host and
tumour cells. Malignant cells lack contact inhibition owing to lack of cadherin
expression (Which normally mediates Calcium mediated intracellular adhesion)
therefore; cell matrix detachment takes place followed by invasion and
migration. Other molecules involved are immunoglobulins, selectins, CD44.Migration
takes place by pseudopodial extension and chemotaxis. Production of degradative
enzymes ( Hydrolases and cathepsin D and proteases) assists in tumour cell
escape. Egress of fluid from primary may also assist cells in gaining access to
capillary or efferent lymphatic channel. It is estimated that < 0.1 % of
tumour cells in vascular system survive and reach the new site. This is
believed to be regulated by immune system i-e- host T lymphocytes and
macrophage response. Fibrin clot surround these migrating cells thereby
isolating them from host’s hostile environment and assists in adhesion to
endothelium. Cells then adhere to vessel wall basement membrane via laminen (a
glycoprotein) cell surface receptors and exit the basement membrane [[50]].
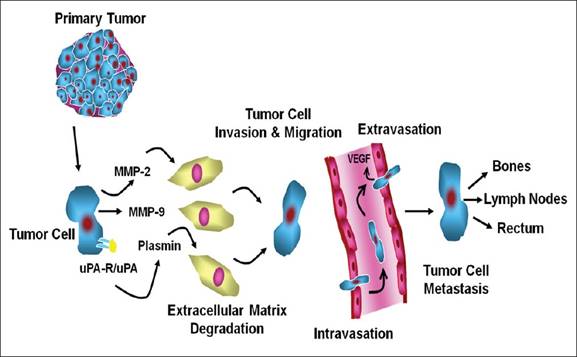
Figure 1.2:
Pathophysiology of Osseous metastasis [[51]]
Platelet fibrin thrombi
and clotting factors causes adhesion and arrest of tumour cells, whereas
chemotactic factors lead to increased mobility of tumour cells. Serine
proteases like matrix metalloproteass and urokinase plasmingen activation
system mediates invasiveness. Cell matrix or cell to cell adhesion and
stimulation of osteoclast and osteoblast activity causes bone lesions resulting
in the invasion of bone matrix.>.5mm lesion requires new blood supply and
tumour angiogenesis factor is secreted that attracts new blood vessels. A
number of other factors are employed in angiogenesis like PGE2, purified
epidermal growth (EGF) and fibroblast growth factor (FGF). In osteoblastic
metastasis there is formation of new bone around the tumour cell deposit. TGF,
fibroblast growth factor and endothelin-1 have been suggested as an activator
of this osteoblastic response. In the patient with carcinoma prostate,
endothelin-1 which is a powerful mitogenic factor is produced in large amounts
by the prostatic epithelium . The initial steps in the development of bone
metastases are similar to those of metastases to any other site. Primary tumour
cells invade their surrounding normal tissue by producing proteolytic enzymes,
which traverse the walls of small blood vessels in the normal tissue or those
induced by the tumour and enter the circulation [[52]].
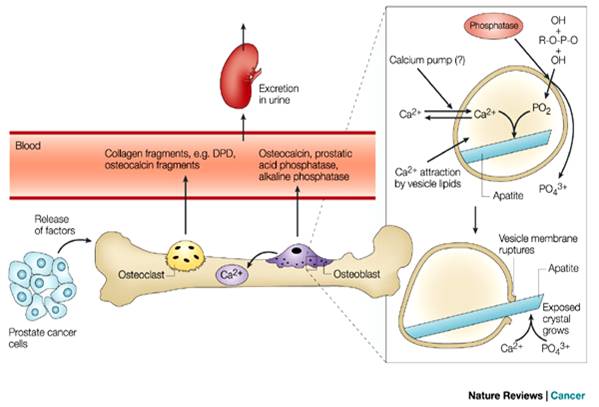
Figure 1.3:
Spread of bone metastasis from Prostate [[53]]
They then travel to
distant organ sites. These events have been described as inefficient, in that
many cancer cells do not survive the normal protective host-surveillance
mechanisms during this initial stages . The cancer cells that do survive can
enter the wide channelled sinusoids of the bone-marrow cavity and are
positioned to become bone metastases. Cancer cells must possess certain
properties for this to occur. They must have the capacity to migrate across the
sinusoidal wall, invade the marrow stroma, generate their own blood supply and
travel to the endosteal bone surface. At this site, they stimulate the activity
of osteoclasts or osteoblasts, thereby determining whether the subsequent bone
metastasis is osteolytic or osteoblastic [[54]].
Each of these steps involves important molecular interactions between the
general mechanism of tumour cell metastasis to bone is as follows:
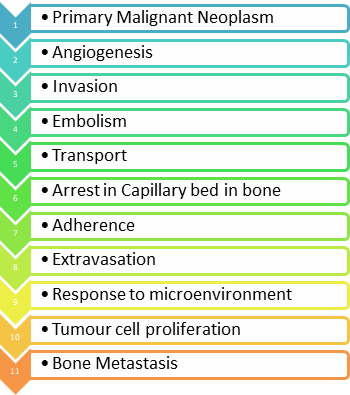
Figure 1.4:
Sequential Involvement of Bone [[55]]
In
osteolytic bone disease, the metastatic tumour cells release humoral factors
that stimulate osteoclastic recruitment and differentiation. Osteoclasts begin
to break down bone. Bone resorption results in release of growth factors that
stimulates tumour cell growth and as the tumour proliferates, it produces
substances that increase osteoclast mediated bone resorption.
In
osteoblastic bone disease, the metastatic tumour cell release growth factors
that stimulate the activity of osteoclasts.Tumour cells also secrete growth
factors that stimulate the activity of osteoblasts that lead to excessive new
bone formation around the tumour-cell deposits. Osteoclast activity releases
growth factors that stimulate tumour cell growth. Osteoblastic activation
releases unidentified osteoblastic growth factors that also stimulate tumour
cell growth [[56]].
Bone
lesion may be lytic, Sclerotic or mixed according to the radiograph appearance
of the lesion. Metastasis from the prostate cancer is typically sclerotic
lesions. Metastasis from the breast carcinoma may be sclerotic or mixed.
Sclerotic lesions have predominant osteoblastic activity while lytic lesions
have predominate osteoclast mediated bone resorption. Mixed lesion show
radiological or histopathological evidence of both osteolytic and osteoblastic
processes.
1.7.1
Osteolytic and Osteoblastic Lesions
Breast
and prostate cancer are the two cancers which usually metastasize to bone, the
end result of metastasis is usually quite different in either cases. In case of
breast carcinoma the metastasis is usually osteolytic. Osteolysis is caused by
osteoclast stimulation not by the direct effect of cancer on bone. Although the
dominant lesion is osteolytic but there is also an osteoblastic response which
presumably is a bone repair process. The increase in bone formation in patients
with osteolytic lesion is reflected by increase levels of serum Alkaline
phosphatase a marker of osteoblast activity and increase uptake of the bone
tracer at the site of bone lesion. However despite of this osteoblastic effect
still the predominant effect is osteolysis.
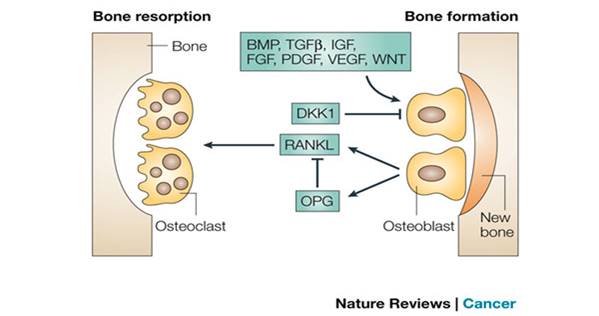
Figure 1.5:
Bone resorption and bone formation [[57]]
However
in the case of prostate cancer the bone metastasis are usually osteoblastic
ones. In case of prostate there is a profound local stimulation of osteoblasts
adjacent to metastatic tumour cells and this is measured by alkaline
phosphatase and Osteocalcin levels. So some patients of breast cancer also show
osteoblastic lesions similarly some patients of prostate cancer show osteolytic
lesions. So there are basically two type of lesions seen in bone metastasis;
osteoblastic and osteolytic but in the carcinoma prostate the osteolytic
lesions predominate.
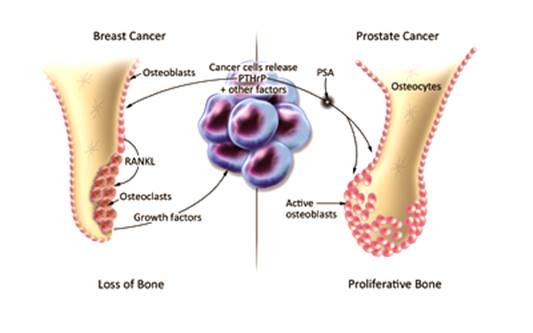
Figure 1.6: Osteoblastic
and Osteoblastic Effects in Prostate and breast Cancer Respectively [[58]]
1.8
Carcinoma Prostate and Osteoblastic Metastasis
There is accumulating
data which shows that the prostate cancer causes osteoblastic lesions. Only 25%
have an evidence of osteoclastic lesions. One of the most well studied mediator
is the Ubiquitus growth factor called Endothelin-, which stimulates bone
formation and osteoblast formation in bone organ cultures. Endothelin-1 is
increased in the circulation with osteoblastic formation in prostate cancer.
1.8.1
The Transforming Growth Factor-β family
Several
members of TGF-β family are powerful in vivo stimulators of new bone
formation and are candidate mediator of bone metastasis. They are highly
expressed by the prostate cells.
1.8.2
Proteases and their Activators
It
has been proved in the literature that in prostate cancer a lot of proteases
and activators are released which results in the osteoblastic bone metastasis [[59]].
1.8.3
Growth Factors
Prostate
cancer releases a large number of osteoblastic growth factors. Which are
potential mediators of osteoblastic proliferation in patients with prostate
cancer.
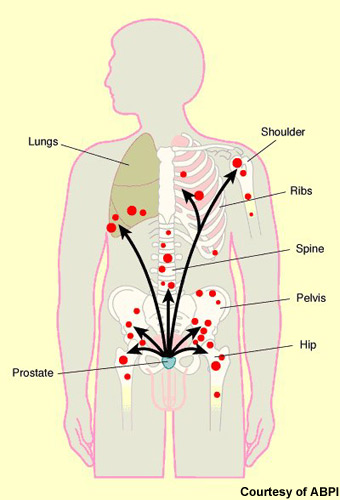
Figure 1.7:
Carcinoma Prostate and Its Spread to Different Sites [[60]]
1.8.4
Bone Micro-Environment
Some
tumours have more avidity towards bone as most circulating tumour cells passes
through the bone marrow as a consequence of its vascularity. There is a concept
that there is a strong relationship between the tumour cells and the host cells
which results in the spread of the tumour. And in case of prostate cancer there
is more osteoblastic metastasis as compared to the osteolytic metastasis as the
pre-dominantly osteoblastic activation system is activated in this case.
1.9
Clinical Presentation of Bone Metastasis
Patient
can present with:
Ø pain,
Ø
Pathological
fractures,
Ø
hypercalcemia
or
Ø Spinal
cord instability with cord compression.
1.10Prostate Cancer
Prostate cancer is a form of cancer that develops in the prostate, a gland in the male
reproductive system. Most prostate cancers are slow growing however; there are
cases of aggressive prostate cancers [[61]]. The cancer cells may metastasize (spread) from the prostate to other
parts of the body, particularly the bones and lymph nodes. Prostate cancer may
cause pain, difficulty in urinating, problems during sexual intercourse,
erectile dysfunction, or death. Other symptoms can potentially develop during
later stages of the disease.
Rates of detection
of prostate cancers vary widely across the world, with South and East Asia
detecting less frequently than in Europe, and especially the United States.
Prostate cancer tends to develop in men over the age of fifty. Globally it is
the sixth leading cause of cancer-related death in men (it is now the first in
the UK and second in the United States). Prostate cancer is most common in the
developed world with increasing rates in the developing world. However, many
men with prostate cancer never have symptoms, undergo no therapy, and
eventually die of other unrelated causes. Many factors, including genetics and diet,
have been implicated in the development of prostate cancer. Recently the
prevalence of light pollution has been implicated in the development of
prostate cancer [[62]].
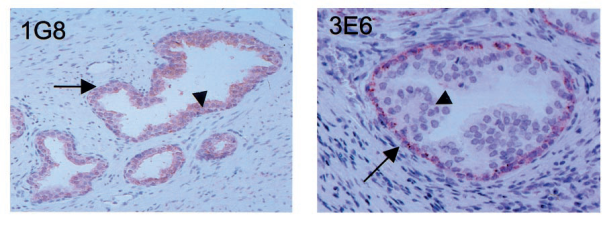
Figure 1.8:
Histology of Normal and Abnormal Prostate [[63]]
Cancer of the prostate is
the most prevalent neoplasm in adult men. A variety of treatment options for
both early and advanced prostate cancer are being studied. Integral to the
clinician’s role in advising the patient about these alternatives is his
knowledge of prognostic
Factors. Pathologists
were among the first to predict tumour behaviour based on the grade of
differentiation. Staging of the disease was added as a prognostic factor, and
the combination of the two is probably the most powerful prognostic tool for
non metastatic disease. However, within each group of patients characterized by
these two parameters, patients still may have different biologic (clinical and
laboratory) parameters that allow them to be stratified further into subgroups
with low and high probability of progression or death. Currently, despite
efforts to increase awareness of early detection, the majority of men with
prostate cancer do not present with organ-confined disease.’ The search for prognostic
factors in advanced prostate cancer probably dates back to the first clinical
trials that evaluated treatment options for this disease. There are a number of
reasons for determining prognostic factors, including (1) to be able to
identify those factors that influence outcome; to adjust the treatment
intensity based on the prognosis of the individual patient; (3) to counsel the
patient and his family properly; and 4) to maintain balance in treatment arms
when comparing treatments. In an extensive analysis of prognostic factors based
on a number of EORTC trials, De Voogt et al. found that age, acid phosphatase
level, haemoglobin level, and performance status were important prognostic
factors in advanced but non metastatic prostate cancer [[64]].
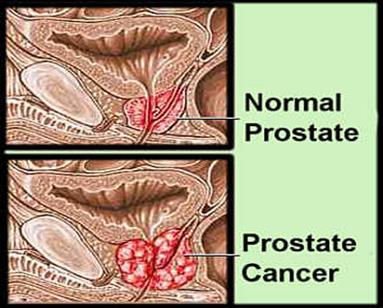
Figure 1.9:
Pathological changes in Prostate cancer [[65]].
1.10.1 Signs
and Symptoms
Early prostate
cancer usually causes no symptoms. Sometimes, however, prostate cancer does
cause symptoms, often similar to those of diseases such as benign prostatic
hyperplasia. These include frequent urination, nocturia (increased urination at
night), difficulty starting and maintaining a steady stream of urine, hematuria
(blood in the urine), and dysuria (painful urination). About a third of
patients diagnosed with prostate cancer have one or more such symptoms, while
two thirds have no symptoms.
Prostate cancer is
associated with urinary dysfunction as the prostate gland surrounds the
prostatic urethra. Changes within the gland, therefore, directly affect urinary
function. Because the vas deferens deposits seminal fluid into the
prostatic urethra, and secretions from the prostate gland itself are included
in semen content, prostate cancer may also cause problems with sexual function
and performance, such as difficulty achieving erection or painful ejaculation.
Advanced prostate
cancer can spread to other parts of the body, possibly causing additional
symptoms. The most common symptom is bone pain, often in the vertebrae (bones
of the spine), pelvis, or ribs. Spread of cancer into other bones such as the femur
is usually to the proximal part of the bone. Prostate cancer in the spine can
also compress the spinal cord, causing leg weakness and urinary and fecal
incontinence [[66]].
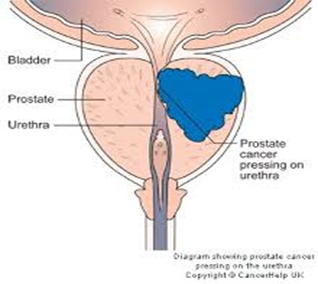
Figure 1.10: Prostate Enlargement Affecting the Urethral [[67]]
1.11Risk Factors
Several
risk factors correlate with the carcinoma prostate even if the underlying
reason for the prostate remains obscure. The major risk factors include:
1.11.1 Age
(65-80years):
One
of the major risk factor for Prostate Carcinoma is ageing. It is very unlikely
in anyone under age of 50. The highest incidence rate is between 65- 80 years,
though younger patient is more curable in younger patients than in older ones,
according to Carter et al. If a curative treatment is to be started, certain
duration of expected survival is usually required. Curative treatment is thus
recommended as being preferable for younger patients. The exponential increase
in the prevalence of prostate cancer by ageing remains unknown [[68]].
1.11.2 Ethnicity
Commonly
seen African and Americans, in whom the mortality rate is more than the
Caucasians.
1.11.3 Diet
Among
the risk factors of PCa has been mentioned. Men with high consumption of meat,
cheese, egg and milk have relatively higher risk of fatal prostate cancer than
others [[69]].
1.11.4 Hereditary
Patients with relatives with history of carcinoma
prostate are at greater risk of developing carcinoma prostate. In a review, Brat
et al pointed out strong relationship between the genetic factors and the
prostate cancer.
1.11.5 Obesity
Several
studies have shown the direct correlation between obesity and the risk of dying
from the aggressive type of carcinoma prostate. It was found that the patients
with Body mass index > 25 were at 1.6 times greater risk of dying from the
disease).
1.11.6 Smoking
It
has been suggested as a risk factor for carcinoma prostate. A large study in
California including more than 43000 men showed an increase in at least 1.9 in
the relative risk in men smoking one pack of cigarette per day) [[70]].
1.12Diagnosis of Prostate
Cancer
Carcinoma
prostate can be diagnosed as: Screening for PSA or Via Clinical symptoms
followed by the Digital rectal examination in patients with symptoms or with
high PSA levels from screening examination, latter tissue diagnosis via biopsy
usually transrectal ultrasound guided repetitive biopsy recommended. After the
diagnosis the carcinoma prostate staging is done via MRI to detect local
staging, Gleason Score, T-Stage, PSA and Bone scans in high risk patients.
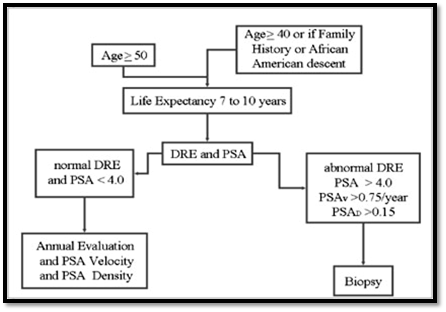
Figure 1.11: Diagnosis of Carcinoma Prostate [[71]]
Moreover
the staging can be done best via TNM staging (American Joint Committee on
Cancer .Clinical T-stage is used along with the Gleason score and the PSA
values to stratify patients with localized Prostate cancer into low-risk,
intermediate risk, or high risk categories.
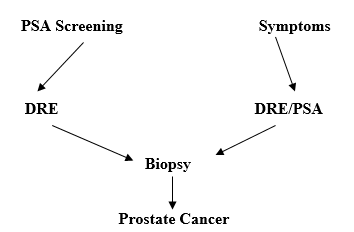
Figure 1.12: Flow Chart showing Diagnosis of Carcinoma [[72]]
PSA has been shown to
have clinical value in monitoring patients with prostate cancer who have
undergone radical prostectomy, radiation therapy or hormonal treatment.
Although PSA has been the current best one for monitoring tool for the prostate
cancer up till now for monitoring tumour response or progression it has
though limitation to test the tumour response in bone. The Prostate cancer can
be staged accordingly as follows
Table 1.2:
Tumour Staging [[73]]
|
Stage
|
Features
|
|
T1a
|
Nonpalpable, with < or =5% of tissue with cancer, low grade
(diagnosed by transurethral resection of the prostate)
|
|
T1b
|
Nonpalpable, with >5% of tissue with cancer, high grade
(diagnosed by transurethral resection of the prostate), or both
|
|
T1c
|
Nonpalpable, but prostate-specific antigen level elevated
|
|
T2a
|
Palpable, < or = 50% of 1 lobe
|
|
T2b
|
Palpable, > or = 50% of 1 lobe, not both lobes
|
|
T2c
|
Palpable, involves both lobes
|
|
T3a
|
Palpable, unilateral capsular penetration
|
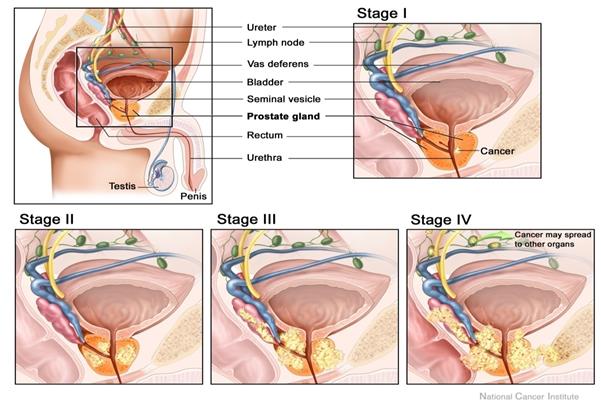
Figure 1.13: Prostate Cancer Staging [[74]].
1.13Importance of PSA
(Prostate Specific Antigen):
Prostate
specific antigen is the only antigen yet reported which has relatively prostate
specificity [[75]].
Monoclonal antibodies that recognise the extracellular domain of PMSA have
recently been reported and are currently being evaluated for use in prostate
cancer and treatment [[76]].
It is a specific tumour marker for the prostate cancer and is clinically
valuable marker for prostatic adenocarcinoma in the initial evaluation of the
patient. It is always correlated with the volume of cancer, pathological stage
of primary tumour, and the presence or absence of metastasis along with the
Pre-treatment and post-treatment status. Although the serum PSA levels appear
to be an important and independent prognostic factor with its interaction with
rest of the factors like clinical staging, Grading and nodal status.
Pretreatment PSA levels is an important in the outcome of the localized
prostate cancer treated with the external beam radiation therapy .Few studies
signifies the prognostic significance of the PSA levels as follows 1: Patients
with PSA less than or equal to 4 ng /ml had a favourable outcome with an
actuarial disease free rate of 95% at 4 years (1 relapsed of 89 treated
patients) 2 : Patients with PSA greater than 4 but less than or equal to
30ng/ml had an intermediate outcome with an actuarial disease-free rate of 80%
at 4 years ( 12 relapsed of 185 treated) ; and (3) patients with PSA greater
than 30 ng/hl who had a poor outcome with an actuarial disease-free rate of
less than 40% at 3 years (12 relapsed of 40 treated) [[77]].
1.14Treatment of Prostate
Cancer
Following
are the options considered for the Prostate cancer treatment
1.
Watchful
waiting.
2.
Surgery
3.
External
Beam Radiation Therapy
4.
Brachytherapy.
5.
Proton
Therapy
6.
Stereotactic
Body radiation Therapy.
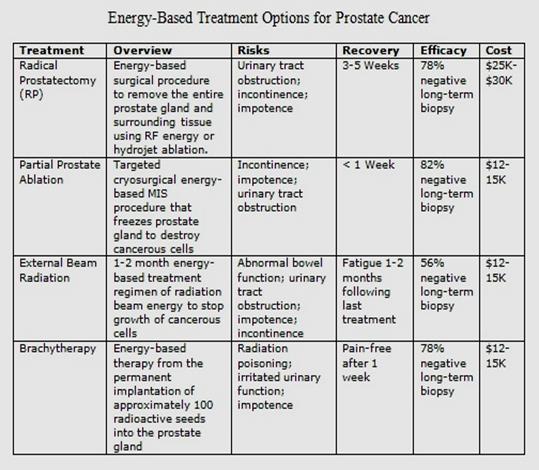
Figure 1.14: Treatment options for Prostate Cancer [[78]].
1.14.1 Watchful
Waiting
It is also named as active Surveillance, Prostate
cancer is monitored closely. Prostate cancer may grow very slowly and may never
need treatment depending on other health factors of the patient. This is the
preferred treatment for those whose cancer is contained in the prostate and who
are not experiencing any symptoms.
1.14.2 Surgery
Most commonly radical
retropubic prostectomy. The prostate gland is removed and may include biopsies
of nearby lymph nodes. Procedure time is usually
3-4 hours usually requiring general anaesthesia and a three day hospital stay.
Recovery at home usually lasts a few weeks.
1.14.3
External beam Radiation Therapy (EBRT)
Also know as intensity modulated radiation therapy or
IMRT.Radiation beams are delivered from an external source. Lacks the ability
to correct for movement of prostate during treatment. Resulting in possible
damage to healthy surrounding tissue. Treatments are outpatient procedures that
usually run five days a week for seven to eight weeks.
1.14.4
Brachytherapy
Small radioactive seeds are implanted within the
prostate gland. Over the course of several months the seeds give off radiations
to immediate surrounding area. Killing prostate cancer cells. Although patient
remains in the hospital for several hours following the procedure and mostly go
home at the same day.
1.14.5 Proton
Therapy
Involved
using a focus ray of proton particle to destroy prostate cancer cells. Beam of
protons are delivered using particle accelerator. These charged particle damage
the DNA of cells, ultimately causing their death or interfering with their
ability to proliferate. Treatment is usually delivered five days a week for
approximately eight weeks.
1.14.6 Stereotactic
Body Radiation Therapy
Delivers
targeted radiation beams to the prostate using without incision or sedation
using Cyber knife technology. Compensates for normal patient movements
minimising damage to healthy surrounding tissue. Patients are treated in five
or fewer outpatient sessions over the course of one or two weeks [[79]].
Figure 1.15: Treatment Options for Different Stages of Prostate Cancer [[80]].
1.15Imaging Metastatic Bone
Disease from Carcinoma of the Prostate
Imaging bone metastasis
from prostate cancer presents several challenges. The lesions are usually
sclerotic and appears late on the conventional X-ray. Imaging has played a
critical role in prostate cancer staging since the development of radiography
of the axial skeleton, but precise indications for and sensitivity and specificity
of conventional imaging methods such as radionuclide bone scanning, computed
tomography (CT), magnetic resonance (MR) imaging, ultrasonography (US), and
combined positron emission tomography (PET)/CT remain under debate. The
literature is replete with controversy about the value of imaging, ranging from
enthusiastic endorsement to serious skepticism. Data from the Cancer of the
Prostate Strategic Urologic Research Endeavours show that from 1995 to 2002,
there was a national shift toward fewer imaging studies in all risk categories;
the proportion of patients receiving any staging imaging test decreased by 63%
in low-risk patients, by 25.9% in intermediate-risk patients, and by 11.4% in
high-risk patients. The most precipitous decreases occurred in bone scan
utilization rates, which decreased by 68.2%, 24.6%, and 11.1% in the low-,
intermediate-, and high-risk groups, respectively. To some degree, these
changes reflect the more appropriate use of imaging in response to the downward
stage migration caused by PSA screening, but it is clear that some high-risk
patients are proceeding to treatment without appropriate imaging evaluation
(i.e., work-up for metastases) [[81]].Optimal
use of imaging is not easy to define. However, this review will provide a
multidisciplinary perspective on the optimal role of imaging in prostate cancer
detection, staging, treatment planning, and follow-up by incorporating
supporting evidence-based data when available.
Bone
Scintigraphy is the mainstay of lesion detection, but not often is suitable for
assessment of treatment response particularly after flare phenomenon after
treatment. Prostate cancer is the second most common cancer in men, accounting
for 1 in 9 of all new cancers, and with more than 670 000 new diagnoses
annually worldwide. The metastatic spread is primarily in the skeleton
(supporting the ‘seed-and-soil’ hypothesis described by Paget in 1889) in which
lesions are often located in vertebra and ribs because of dissemination through
Batson’s venous plexus. The spread in bone also follows the distribution of
adult red bone marrow, that is, skull, thorax, pelvis, spine, proximal long
bones [[82]]
subsequently progressing to involve adjacent cortical bone. Preclinical models
confirm that skeletal sites rich in cellular marrow with active turnover show
increased cancer localisation [[83]].
Although predominantly osteoblastic, osteoclast activation also has an
important role in the growth of sclerotic metastases in the bone. In a study of
patients with prostatic bone metastases who underwent surgery for stabilisation
of pathological fracture or impending fracture, most metastases were
osteoblastic, but 29.1% had metastases that were osteolytic or mixed [[84]].
Skeletal metastases occur
in approximately 90% of patients presenting with advanced prostate cancer, and
the burden of bone disease directly correlates with survival [[85]]. After
treatment of the primary site, bone is the first site of relapse in more than 80%
of cases [[86]].
Plain film and bone scintigraphy studies form the mainstay of detection, but
they underestimate true incidence. In one autopsy series of 1589 men with
prostate cancer (47% were unsuspected), the incidence of metastatic bone
disease was 90% [[87]].
The
detection of bone metastases indicates progression to lethal prostate carcinoma
[[88]]. At this
stage, complete remissions are rare and onset of the complications of bone
metastases are likely [[89]].The
investigation of therapeutic intervention and its complication to slow the
progression of bone disease and its complications make the need for accurate
assessment of disease burden in the bone and its response to treatment of
fundamental importance. PSA is used widely to monitor response to therapy, with
a decrease in PSA to the normal range after treatment used as a predictor of prolonged
response in many patients. However, PSA levels are influenced by both soft
tissue and bony disease and PSA does not always correlate with tumour burden.
Imaging bone disease in prostate carcinoma frequently involves a cascade of
studies that start with Tc99m methylene diphosphonate (Tc99mMDP)
bone scintigraphy, backed up by plain film correlation and followed by magnetic
resonance imaging (MRI), computerised tomography (CT) or even positron emission
tomography (PET)/CT. The implications of this multistep approach involve
patient time, imaging time, costs and radiation dose. Validation of imaging
biomarkers for bone derived from these studies has been hindered by a lack of a
gold standard, as histological verification is not appropriate. Previous arguments
that MRI is too costly and time consuming need to be revisited, particularly in
the setting of its increased availability, and with the development of
functional imaging approaches. Currently, the assessment of therapeutic
response in clinical trials relies solely on qualitative assessment on bone
scintigraphy, as Response Evaluation Criteria in Solid Tumours (RECIST)
criteria classify osteoblastic bone metastases as non measurable [[90]]. This
article reviews the characteristics of prostate bone metastases recognised with
various imaging techniques in the context of their pathogenesis and explores
the potential of these techniques for assessing tumour burden and response to
therapy.
Prostate
cancer is one of the most common diseases in the world. It primarily
disseminate to the bone causing bone metastasis which can lead to death. To
treat the disease it is important to diagnose bony metastasis as soon as
possible. Bone metastasis is usually diagnosed by bone scan imaging. However
the interpretation of bone scan imaging is not always an easy task for the
physician. One way of minimizing the risk of misinterpretation is qualitative
analysis of bone scan image in order to ascertain whether they show any
metastatic lesion, if so, to what extent. Quantification of bone scan that is
Bone Scan Index Method could be used for the prognosis of survival or to follow
up the effect of treatment [[91]].
1.16Prognosis of the Prostate
Cancer
This is the fact that the
tumour response and disease progression represents a fundamental dichotomy the
former is the time tested marker of therapeutic efficacy, whereas the latter is
an essential sign of treatment failure [[92]].
Prostate cancer is the most common internal cancer in men.
(For men, skin cancer is the most common cancer, and only lung cancer causes
more cancer deaths.) About 1 in 6 men will be diagnosed with prostate cancer
over the course of their life. But because so many prostate tumors are
low-grade and slow growing, and men are usually older when they are diagnosed
with it, most men diagnosed with prostate cancer eventually die of something
else. The prognosis for men with localized prostate cancer is excellent. Nearly
100% of men with localized prostate cancer live at least 5 years after
diagnosis. The same is true for men with regional prostate cancer, which means
the cancer has spread from the prostate gland to nearby areas in the body. Only
about 5% of men are diagnosed with advanced or distant cancer that has spread
throughout the body. For these men, the 5-year relative survival rate is 29%.A
survival rate indicates the percentage of patients who live a specific number
of years after the cancer is diagnosed. A relative survival rate compares the
survival of people with a specific type of cancer to the expected survival of
people who do not have cancer and will die from other causes. Overall, for
prostate cancer, the 10-year relative survival rate is about 98% and the
15-year survival rate is about 91%. After 15 years, survival rates stabilize.
The odds of survival depend in part on how far advanced the cancer is when a
man is first diagnosed. Men diagnosed with low-grade prostate cancers have a
minimal risk of dying from prostate cancer for up to 20 years after diagnosis.
However, men diagnosed with more aggressive forms of prostate cancer have
a higher risk of dying within 10 years. If cancer recurs after initial
treatment for early-stage tumours, it is still potentially curable if it is
contained within the prostate, although in most cases the cancer has spread.
Hormone treatments for such recurring cancers can often prolong survival for
years, although the cancer almost always returns again [[93]].
1.16.1
Progressive Disease and Its Outcome
Table 1.3:
Disease Progression and Outcomes [[94]]
|
Response
|
Progression
|
|
Timing is Assessment
|
Assessed early in treatment Course
|
Assessed in intervals until change of therapy
|
|
Role in Clinical Practice
|
Normally used to determine whether to change therapy
|
Commonly used to determine when to change therapy
|
|
Role in Clinical Research
|
Primarily used to calculate overall response rate
|
Primarily used to calculate time to progression end points
|
The determination of
progression is an essential part of the treatment and study of patients with
solid tumours because it allows the calculation of clinical trial endpoints and
also assists in determining clinical treatment failure. Yet a growing body of
literature suggests that our current objective criteria for progression may not
always indicate treatment failure and do not adequately capture disease
biology, potentially limiting their value in clinical trial analysis [[95]].
1.17Imaging modalities
The
selection of imaging modality of a prostate cancer patient should be done based
on the question that needs to be answered for a particular patient. Transrectal
US, MR imaging, CT, radionuclide bone scanning, and PET each have advantages,
disadvantages, and specific indications.
Accurate
staging is important in the management of Prostate cancer patient. Low risk
patients, based on Gleason score, Clinical T-stage and PSA values, have a low
probability for metastatic disease, and imaging is not recommended. There are
different modalities which are used for the localisation of Bone metastasis. It
includes the following modalities:
Ø CT
Ø
SPECT/CT
Ø
PET/CT
Ø
MRI
Ø
Transrectal
US
Ø Bone
Scintigraphy
1.17.1 CT
Although
CT continues to be widely used in patients with newly diagnosed prostate
cancer, it has virtually no role in prostate cancer detection or primary tumour
staging. On CT scans, the separation between the prostate and the levator ani
muscle is poorly defined, and intraprostatic anatomy is not well demonstrated.
However, because of increased temporal resolution, multidetector CT, when
properly performed, can more clearly depict intraprostatic anatomy. The major
role of CT is in the nodal staging of prostate cancer, for which it is limited.
Nomograms based on clinical data (PSA level, Gleason grade, DRE findings)
provide risk stratification estimates that guide the appropriate ordering of
imaging tests, including CT. For instance, it is recommended that CT should be
performed only in patients with a PSA level greater than 20 ng/mL, Gleason
score greater than 7, and/or clinical tumour stage T3 or higher . This is
because the criterion for detection of positive nodal disease at CT is based on
node size (> 1 cm diameter), and nodal enlargement due to metastases occurs
relatively late in the progression of prostate cancer. Since nodal metastases
are often microscopic, neither CT nor standard MR imaging can be used to
reliably rule them out. Reported CT sensitivity for the detection of lymph node
metastases varies, but it is typically in the range of 36%. One study published
in 1980 reported an 85% sensitivity and 67% specificity, while another
published in 1988 reported specificity of as low as 25% , which reflects the
changes in the presentation of prostate cancer. Oyen et al found a sensitivity
of 78% and a specificity of 97% by using a size criterion of 0.6 cm or larger.
The same study also reported a specificity of 100% for CT combined with
CT-guided fine-needle aspiration biopsy. The smaller size criterion (0.6 cm)
and use of fine-needle aspiration have not been widely adopted. It should be
noted that the reported sensitivity and specificity of CT are highly dependent
on the proportions of high-, medium-, and low-risk patients in the population
studied [[96]].
Overutilization
of CT in the past may have been due in part to the emergence of widespread PSA
testing and the resultant rapid shift toward detection of early-stage disease.
Currently, the majority of patients with newly diagnosed localized prostate
cancer are at low risk for metastases, and the diagnostic yield of CT is low in
these patients. However, unusual or discrepant clinical data may prompt imaging
even if an individual's risk falls below the recommended thresholds.
CT
can be useful as a baseline examination in high-risk patients with clinically
apparent, grossly advanced local disease (gross extracapsular disease, gross
SVI, or invasion of the surrounding structures, including bladder, rectum,
levator ani muscles, or pelvic floor). These patients will almost always fall
above the cutoff recommendations for the appropriate use of CT imaging on the
basis of DRE findings, PSA level, and Gleason grade; they will also be at risk
for lymph node metastases, which may be assessed concurrently [[97]].
Metastatic
lymph nodes (stage M1) are nodes that lie outside the confines of the true
pelvis as outlined earlier, with enlarged nodes typically measuring more than
1.0 cm in the short axis. Nodal disease often progresses in a step-wise
fashion, such that retroperitoneal or meditational nodal disease is most often
accompanied by pelvic lymphadenopathy in the obturator regions .Metastases to
the pelvic lymph nodes, thought to be uncommon in patients with early-stage
prostate cancer, are reported in only 2%–5% of patients, but there is some
uncertainty about the adequacy of pelvic lymphadenectomy in those series.
Removal of grossly enlarged nodes has not been shown to have therapeutic value
in prostate cancer. However, removal of microscopically positive pelvic lymph
nodes during prostatectomy does provide long-term cancer control in 15%–20% of
patients. The cancer-specific survival rate for patients with positive pelvic
lymph nodes is excellent (83% ± 3 at 10 years for patients with lymph node
metastasis found at pelvic lymphadenectomy).
CT
has been used to monitor bone metastases, but bone scanning and MR imaging are
superior to CT in the diagnosis of bone metastases. Lytic and blastic bone
metastases will commonly be visible at CT, however, and should not be
overlooked. CT scans may be normal in cases of metastatic disease detected at
radionuclide bone scanning, but CT allows more accurate distinction of
malignant from benign causes of increased radioisotope uptake at bone scanning.
Individual osseous metastases are more accurately defined as individual lesions
on a CT scan than on a bone scan and, therefore, clear changes in osseous
lesions seen at CT can be used to monitor responses to systemic therapy.
Caution should be exercised in interpreting all osteoblastic lesions as
metastases, as CT typically depicts the effects of tumour cells on normal
osteoblasts rather than directly reflecting metastases, and bone changes in
response to therapy may lag behind therapeutic effects [[98]].
1.17.2 SPECT/CT
Structural along with the
statistical information about cancer of different organs can also be obtained
using dual modality imaging which are CT scan and the SPECT. The CT scan tells
us about the structural information of the body whereas the SPECT tells us
about the functional status of that organ. SPECT/CT provides more precise
information about the lesion in the vertebrae [[99]].
1.17.3 MRI
This is used in the cancer
patients for the Carcinoma. It is usually used for the local staging of the
early prostate cancer. With MRI it is possible to distinguish between soft
tissues with different properties. The carcinoma Prostate can be more
accurately précised by MRI as compared to the rest of the organs especially
with the extra capsular extension [[100]].
1.17.4 PET
It can provide high
resolution three dimensional imaging of the human body. This method together
with CT scan has proved to be very highly specific for enabling the metastasis
in bones and tumour in soft tissue tumour. The limitation lies with the cost
and availability of the modality in different hospital set up [[101]].
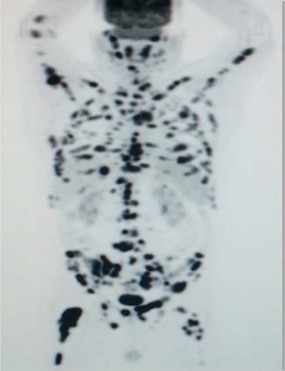
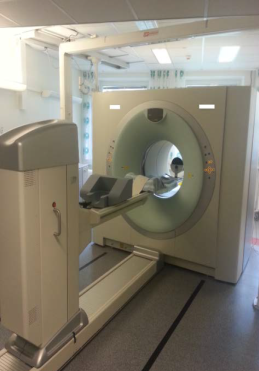
Figure 1.16: PET scan [[102]].
1.17.5 Transrectal
US
Transrectal
US is the most widely used clinical imaging method, and it is the essential
imaging tool for prostate cancer biopsy guidance. It is indicated to guide
prostate biopsy when abnormal rectal examination is detected for prostate, to
guide application of cryothreapy and brachytherapy for the treatment of
prostate cancer, to evaluate and stage prostate and rectal cancer, to evaluate
and guide treatment for prostate, rectal, anal abscess, tumour fistula or any
pelvic inflammatory disease.
It
is easy to use, widely available and less expensive. Moreover it does not use
any ionizing radiation, gives a clearer picture of soft tissue that cannot be
seen in X-rays, causes no health problems and can be repeated as much as can if
indicated for any health problems. It provides real-time-imaging so Is
perfectly good for minimally invasive procedures such as needle biopsy and
fluid aspiration. The disadvantages if the transrectal USG is that the patients
with their bowel removed during or prior surgery are not good candidates for
USG of the prostate as it always require a placing a probe into the rectum.
When prostate cancer is suspected, the diagnostic test of choice is a
systematic needle biopsy with US guidance. Before biopsy, the patient is
prepped with an enema and antibiotics (quinolone analogs). With the patient in
the decubitus position, the transrectal US probe is placed in the rectum, the
prostate and seminal vesicles are visualized, and the images are recorded in
transverse and sagittal planes. And moreover the biopsy can be taken
simultaneously under the USG guidance. A single biopsy session has a
sensitivity of 70%–80% for the detection of cancer. To minimize the need for
repeat biopsy sessions, many physicians obtain more cores the first time. Separate
samples of the anterior prostate (or transition zone) are usually not obtained
unless previous biopsy sessions have failed to find a suspected cancer (eg, in
a patient with a high PSA level, abnormal findings at digital rectal
examination [DRE], and multiple negative peripheral zone biopsy specimens), or
imaging with transrectal US or MR suggests an anterior cancer [[103]].
Diagnostically,
transrectal US is used to measure the volume of the prostate gland, an
important factor in computing “PSA density” (serum PSA level in nanograms per
millilitre divided by the volume of the prostate in cubic centimetres).
Moreover, the volume as measured with transrectal US can be used in staging and
in predictive nomograms. Cancer, depending on its size, grade, and location,
usually appears hypoechoic relative to the normal peripheral zone of the
prostate (only approximately 1% are hyperechoic). As a diagnostic test for
cancer, transrectal US without biopsy is as accurate as DRE and complements the
physical examination. Some palpable cancers are not visible at US, and some
visible cancers are not palpable. With the shift toward smaller, early-stage
cancers, many cancers detected at biopsy are not visible at US (low
sensitivity) and many hypoechoic areas do not prove to be malignant at biopsy
(low specificity); therefore, transrectal US alone, without the addition of
biopsy, has limited value in the detection of cancer [[104]].
Transrectal
ultrasound has been used for the staging of primary cancer but is generally
considered insufficient. The criterion for identifying extracapsular extension
on transrectal US scans are bulging or irregularity of the capsule adjacent to
a hypoechoic lesion. The length of the contact of a visible lesion with the
capsule is associated with the probability of extracapsular extension. Seminal
vesicle invasion (SVI) is heralded by a visible extension of a hypoechoic
lesion at the base of the prostate into a seminal vesicle or by echogenic
cancer within the normally fluid-filled seminal vesicle. Asymmetry of the
seminal vesicles or solid hypoechoic masses within the seminal vesicles are
indirect indicators of disease extension. When extraprostatic extension into
the seminal vesicles is suspected, additional transrectal US-guided biopsies of
the seminal vesicles can be performed.
Transrectal
US continues to play an important role in therapy. Worldwide, transrectal US is
the modality of choice for directing brachytherapy seeds into the prostate .
Cryotherapy of the prostate also requires US guidance as does high-intensity
focused ultrasound, which, coupled with US targeting, is used for focal
ablation of prostate cancers. New treatment approaches such as hyperthermia,
photodynamic therapy, and direct injection of oncolytic viruses, tumor
vaccines, and gene therapy also depend on transrectal US for easy access to
cancers of the prostate. While guidance techniques using MR imaging and other
modalities are being developed, transrectal US will continue to play a major
role in the management of prostate cancer, not least because of its wide
availability and relatively low cost. Of course, the advantages of transrectal
US (flexibility and relatively low cost) are balanced by its limited ability to
define the prostate cancer in situ. The latter makes evaluation of US-guided
therapies difficult, because recurrence could result either from the tumor
being missed during treatment or from the inability of the treatment modality
to kill the tumor [[105]].
Future
developments in transrectal US include the use of microbubble contrast agents
and targeted imaging. Microbubbles are relatively large, micrometer-sized,
gas-filled bubbles that can be seen with exquisite sensitivity with real-time
US. Indeed, by using harmonic imaging and encoded phased imaging, single
microbubbles can be detected. Moreover, microbubbles can be coated with surface
ligands, which preferentially target tumor neovascularity. Because of their
large size (>1 μm), these agents are mostly confined to the vascular
space and hence provide information primarily about large-vessel
microvascularity but nonetheless could play a major role in improving cancer
detection in the future [[106]].
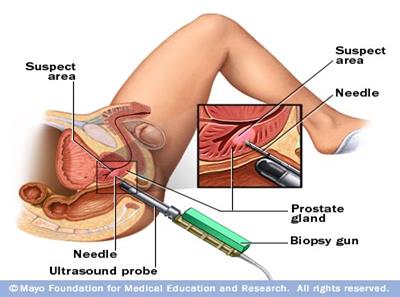
Figure 1.17: Ultrasound guided biopsy of prostate [[107]]
1.17.6 Bone
Scintigraphy
The
bone scintigraphy is usually indicated in neoplastic diseases, occult
fracture,osteomyelitis, stress reaction, stress fracture, avascular necrosis,
arthritidies, reflex sympathetic dystrophy, bone infarcts, bone graft
viability, otherwise unexplained bone pain,distribution for osteoblastic
activity before treatment for the bone pain. The axial skeleton, the primary
site of active marrow, is the most common distribution of metastatic spread for
patients with prostate cancer. At this time, there is no standard means by
which osseous lesions can be directly visualized or quantified; thus, there is
no qualified imaging biomarker for prostate cancer. Over the last 30 years we
have seen revolutionary developments in the field of medical imaging. Three
dimensional motion algorithms for calculation of myocardial elasticity using
MRI .Quantitative measurements of myocardial perfusion using PET and
quantification of left ventricular function from gated SPECT are few examples.
Moreover few internal organs like brain and spine can be used for three
dimensional volumetric imaging such as CT and MRI. Quantitative analysis is
common in areas like nuclear cardiology but due to the last few years different
researches have been carried out for the quantification of bone metastasis on
bone scans.
Bone
scintigraphy is commonly used to assess disease burden and treatment effects,
but it is an imperfect modality for quantifying disease or for demonstrating
treatment effects. Bone scans do not specifically identify cancer, can
paradoxically worsen in the face of response (“flare”), and frequently improve
only slowly if at all, despite patients receiving active treatments.
Nonetheless, bone scans are standard, widely used, and reimbursed, and
therefore they appear in nearly every clinical trial of castration-resistant
metastatic prostate cancer (CRMPC) as eligibility criteria and response measures.
To mitigate the shortcomings of bone scintigraphy, there has been a recent
effort to standardize bone scan interpretation and data collection by using
consensus criteria to define progressive disease, control for flare, and
establish criteria for data collection. These end points are being validated in
several ongoing phase III studies. However, to develop bone scintigraphy as an
imaging biomarker, a quantitative measure is needed for comparing baseline and
on-treatment status. In the past, methods of quantifying bone lesions have
included lesion counting, lesion scoring on a scale from 0 to 2, lesion rating
of negative versus positive. The bone scan index (BSI) was developed as a
quantitative tool to improve the interpretability and clinical relevance of the
bone scan. The BSI is a method of expressing the tumour burden in bone as a
percent of the total [[108]].
1.17.6.1
Rational
of Bone Scintigraphy
Bone
scintigraphy is a diagnostic study used to evaluate the distribution of active
bone in the body anywhere due to any pathology.
1.17.6.2
Patient
Preparation and Procedure
Whole
procedure should be explained to the patient and unless any contraindication
patient should be well hydrated and is instructed to drink two or 8 oz glasses
of water between the time of injection and the time for delayed imaging. The
patient should be directed to micturate immediately before delayed image and
drink plenty of water for at least 24 hours of radiopharmaceutical
administration.
1.17.6.3
Radiation
Dosimetry in Adults
Table 1.4:
Radiation dosimetry in adults [[109]]
|
Radiopharmaceutical
|
Administered Activity
MBq (mci)
|
Organ Receiving the
Largest Radiation Dose mGy/MBq (rad/mCi)
|
Effective Dose mSv/MBq
(rem/mCi)
|
|
99mTc-Phosphates
and Phosphonates
|
740-1110
(20 - 30) Intravenously
|
Bone
0.063 -0.23
|
0.008
-0.03
|
1.17.6.4
Uptake
Mechanisms of Bone Seeking Radiopharmaceuticals
Bone
is a composite material of inorganic crystals bound to protein. The mineral
phase, built of crystals containing mainly calcium and phosphate, is called
hydroxyapatite. This mineral phase is bound to a matrix largely consisting of a
single protein, collagen. The mineral content determines the stiffness of bone.
Without sufficient mineralization, bones will plastically deform under load. Collagen
provides toughness to bone, making it less brittle so that it better resists
mechanical stress. The healthy adult bone is in homeostasis, with a constant
rate of remodelling due to the activity of osteoblasts laying down new bone and
osteoclasts resorbing old bone. Bone adapts to repetitive mechanical stresses
largely by changing its size and shape, which are major determinants of its
resistance to fracture. Anatomically, bone tissue consists of compact
(cortical) and cancellous (trabecular) bone, which perform different functions;
compact bone forms the diaphyses of long bones and the surface of flat bones,
whereas cancellous bone is found in the epiphyseal and metaphyseal regions of
long bones and the interior of flat bones. Bone is in a constant state of
remodelling or turnover, which is essentially a surface phenomenon. Although
cortical bone forms most of the bone mass, it represents the minority of bone
surface. By comparison, cancellous bone forms only 20% of the bone mass but
accounts for 80% of the bone turnover associated with remodelling [[110]].
1.17.6.5
Physiologic
Mechanism of Radiopharmaceutical Uptake
The
pharmacokinetics of bone-seeking radiotracers essentially depends on the rates
of bone uptake and elimination from the circulation via renal excretion.
Radiotracer Delivery 99mTc-labeled diphosphonates (99mTc-MDP and
99mTchydroxymethylenediphosphonate) and 18F-NaF are essentially markers of both
bone perfusion and bone turnover. After intravenous administration, the
principal uptake mechanism of bone-seeking radiotracers involves adsorption
onto or into the crystalline structure of hydroxyapatite. The first step in
this cascade is radiotracer delivery, which depends on local blood flow and the
rate of radiotracer extraction by bone. 99mTc-MDP undergoes protein binding in
blood, which increases over time from around 25% at injection to about 50% at 4
h after injection. Only unbound tracer will be available for bone uptake.
According to the simplified Renkin and Crone capillary transport model, the net
exchange of a substance between blood and tissue depends on blood flow, surface
area, and the permeability of the capillary system. 99mTc-MDP undergoes passive
diffusion through the capillary wall into the extravascular space. The
diffusion rate is proportional to the molecular size; therefore, diffusion of
small molecules is expected to be more rapid than that of 99mTc diphosphonates.
In addition, there is evidence that the extraction fraction of
99mTc-diphosphonates varies with blood flow. Performing outflow dilution
experiments in, McCarthy et al. showed that the extraction fraction of
99mTc-MDP decreased substantially with increasing blood flow [[111]]. In
addition, they determined that the permeability-surface area remained
unchanged, indicating that additional recruitment of capillaries under high
flow conditions does not occur. It is observed that there is increased blood
flow on 99mTc-MDP uptake to the area, secondary to the presence of a primary
bone malignancy. In contrast to g-camera imaging, PET imaging allows absolute
quantification of radiotracer concentrations in tissue. Dynamic PET compartment
modelling is needed to measure bone blood flow and the metabolic rate of
fluoride binding to bone.
1.17.6.6
Radiotracer
Localization to Bone
The
mechanism of binding of extravascular 99mTc diphosphonates to bone is due to
physicochemical adsorption (chemisorptions) to the hydroxyapatite structure of
bone tissue. Using autoradiography, the deposition of 99mTc diphosphonates was
found to occur at the mineralization front of bone (osteoid) and at the
osteocytic lacunae, but not near osteoclasts. In the growing skeleton, mineral
deposition is predominantly seen at epiphyseal growth plates and osteochondral
junctions. In contrast to 99mTc-diphosphonates, a certain fraction of
extravascular fluoride is directly incorporated into the bone matrix, because
fluoride ions exchange with hydroxyl groups in the hydroxyapatite crystal of
bone to form fluoroapatite [[112]].
1.17.6.7
Renal
Excretion
99mTc-diphosphonate
compounds belong to the class of bisphosphonates, which are not significantly
metabolized in vivo. Thus, renal excretion is the primary route for their
elimination. Hyldstrup et al. showed that the renal filtration fraction of free
(non–protein-bound) 99mTc-MDP is the same as that for 51Cr-ethylenediamine
tetra acetic acid, itself a measure of the glomerular filtration rate; thus,
the renal elimination rate of 99mTc-diphosphonates depends mainly on glomerular
function. Since the plasma binding of 18F-NaF is small, fluoride ions are freely
filtered in the glomeruli. Fluoride, however, also undergoes tubular
reabsorption. As a result, renal clearance of 18FNaFis dependent on overall
urinary flow, because tubular reabsorption of fluoride increases with
decreasing glomerular filtration rate. Therefore, it is recommended that
patients undergoing 18F-NaF PET be well hydrated to reduce radiation exposure.
1.17.6.8
Environmental
Factors Influencing 99mTc-MDP Accumulation
Other
environmental factors may influence the accumulation of 99mTc-MDP and 18F-NaF
as well. Although renal clearance of 18F-NaF is modulated by urinary pH and
diet, renal clearance of 99mTc-MDP is affected by phosphate concentration and
pH. Also, the adsorption of 99mTc- MDP to hydroxyapatite appears to increase at
low pH [[113]].
1.17.6.9
Serial
Bone Imaging at Multiple Time Points
Pathophysiology
of Bone Metastases. Disseminated tumour cells that successfully invade bone
depend on adhesion mechanisms, interacting with the extracellular matrix
Staging of Bone Metastases. Bone scans are sensitive, cost-effective,
whole-body imaging modalities for staging cancers that have a predilection for
bone metastases, with overall sensitivity between 62% and 100% and specificity
of 78%–100%. However, false-negative studies are commonly seen with osteolytic
lesions, resulting in poor sensitivity (as low as 50% for myeloma). Use of
SPECT/CT has been shown to improve specificity, with a reduced number of
indeterminate bone lesions (compared with planar imaging) for staging of lung
cancer bone metastases.
18F-FDG PET/CT for
oncologic staging is highly sensitive for detection of bone metastases. For
staging of lung cancer skeletal metastases, a meta-analysis that included 7 Studies
(1,794 patients) reported 18F-FDG PET sensitivity of 98% and specificity of
95%—superior to the conventional bone scan sensitivity of 87% and specificity
of 82%. On imaging, osteoblastic, osteoclastic, or mixed phenotypes lead to
mainly sclerotic, lytic, or mixed lesions, respectively. The predominant
phenotype affects the detection potential of radiotracers. Thus, 18F-FDG PET
has higher sensitivity for early marrow metastases and lytic lesions than do
bone-seeking tracers.
18F-NaF PET is a highly
sensitive method for detection of primary bone tumours and osseous metastatic
disease from a range of primary tumors, including lung, breast, prostate,
thyroid, and squamous cell cancers of the head and neck. Generally, increased
18F-NaF uptake is found in sclerotic and mixed lesions and at cortical
locations. 18F-NaF PET has superior sensitivity to 99mTclabeled diphosphonate
bone scanning using planar and SPECT protocols. When combined with hybrid PET/
CT imaging, 18F-NaF was able to clarify many findings otherwise equivocal on
conventional bone scanning. Krüger et al. compared 18F-NaF PET with 18F-FDG PET
and 99mTc-MDP bone scanning in 126 patients with non–small cell lung cancer.
18F-NaF PET was superior in sensitivity to 99mTc-MDP and comparable to 18F-FDG
PET. For biochemical relapse of prostate cancer, 18F-NaF appears to have
greater diagnostic yield than 18F-FDG. In a comparative study between 18F-NaF
PET and 18F-choline PET, 18F-NaF resulted in higher numbers of detected bone
metastases, although detection of additional sites of disease did not alter
management 18F-NaF uptake may display a post treatment flare phenomenon,
similar to that reported in 99mTc-MDP bone scans [[114]].
1.18Bone Scintigraphy in the
Assessment of Bone Metastasis
Change in bone mineral
turnover, whereas the bone must demineralise by 50% before a lesion is detected
by plain film. It can also detect bone metastases up to 18 months before plain
film reveals them [[115]].
However, because bone scintigraphy images the secondary effects of the tumour
on the skeleton, false positives occur from degenerative change, inflammation,
Paget’s disease and trauma. The osteoblastic response that occurs as a result
of bone healing/flare response can also lead to a false-positive diagnosis of
disease progression. The sensitivities and specificities for detection of bone
metastases by MDP bone scintigraphy have sometimes been quoted, but the absence
of a histological gold standard means that these are not sensitivities and
specificities in the true sense. Comparators vary from study to study, but PSA,
soft tissue disease, follow-up and other imaging modalities are often used as a
gold standard, all with their own limitations. The flare phenomenon on
radionuclide bone scan in patients with prostate cancer has been reported at
anywhere between 6 and 25% and is also a feature observed on plain film. It may
be because of an increase in blood flow caused by an inflammatory response or
an increased turnover of hydroxyapatite in the new bone laid down as part of
the healing process. In prostate cancer, if the scan taken 3 months after
introduction of therapy shows worsening of disease, there is a high probability
that this is real. If, however, the patients’ clinical parameters indicate a
response, then flare should be considered. A follow-up scan at 6 months can
resolve the issue .Regardless of the flare phenomenon, the sensitivity of bone
scintigraphy in detecting a response to therapy remains questionable;
metastases showed by bone scintigraphy have been shown to remain stable despite
other parameters indicating a response found purely sclerotic bone metastases impossible
to assess on bone scintigraphy, as increased sclerosis without scintigraphic
changes occurred in the responding and non-responding patients. In the
responding patients (as judged by disease in non-osseous sites), any detectable
response on bone scan is often delayed by up to 6–8 months and it can take over
2 years for complete resolution of bone scintigraphy findings , even when all
of the disease has been eliminated from the bone. Conversely, a stable positive
scintigraphic lesion, in conjunction with a fading sclerotic lesion on
radiographs in a positive scintigraphic lesion, can be a sign of progression .A
further source of debate is the occurrence of a new lesion on bone
scintigraphy. Previously, this was thought to rule out flare response but it
has been shown that appearance of a new lesion on bone scans or plain film
within 6 months of initiation of therapy can be a part of the flare response as
a result of the healing of previously occult lesions [[116]].
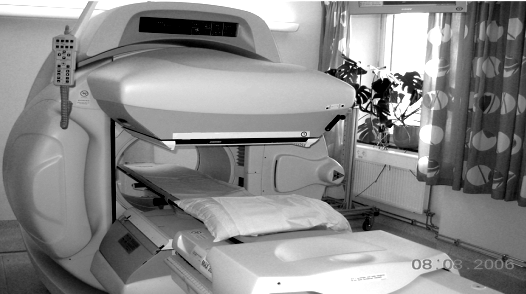
Figure 1.18: Gamma Camera with capability to acquire planar whole body
and tomography images [[117]].
Descriptive reports
provided by bone scintigraphy, although useful for diagnosis, are limited when
assessing the response to therapy, in which more quantitative information is
desirable. The Bone Scan Index proposed by Imbriaco et al, which quantifies the
proportion of the skeleton involved by tumour as well as the distribution of
disease, has not been widely adopted. Other proposals include an automated
assessment of the percentage of involvement by metastatic bone disease on bone
scintigraphy to monitor response to therapy. Although scoring systems of this
type may relate to prognosis and response to therapy, they can be time
consuming and variable.Other limiting factors are the lack of anatomical
detail. Combined single-photon emission computerised tomography (SPECT) and
X-ray CT improve anatomical detail and reduce the number of equivocal lesions
detected on bone scintigraphy [[118]].
Bone scintigraphy therefore does have a role in the assessment of prostatic
bone metastases but should not be used in isolation when considering response
to therapy.
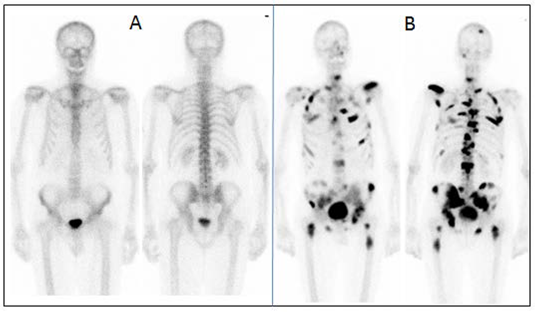
Figure 1.19: (A) Normal and (B) Pathological bone scan [[119]].
1.19Quantitation of Bone
Metastasis Using Bone Scans
Different methods for the
quantitation have been used for the calculation of tumour burden in the
carcinoma prostate and other metastatic bone diseases. These methods include
the following:
1.19.1 %BSI
Quantitation Method
This method was first
designed by David et al. in an article named ‘A
Novel automated platform for quantifying the extent of skeletal tumour
involvement in prostate cancer patients using the Bone Scan Index’. In
this study analysed 263 bone scans from 90 patients being studied under four
protocols at Memorial Sloan-Kettering Cancer Centre for progressive ,androgen
independent prostate cancer (APIC), who had bone scans as a part of
their work-up. This study was based upon (a) the intraobserver and
interobserver variability of the BSI: (b) the intraobserver and interobserver
variability of the BSI; (c) the comparison between a change in BSI and
prostate-specific antigen (PSA); (c) the regional distribution of bony
metastases in early stage D prostate cancer (<3% skeletal involvement); and
(d) the rate of growth of bony metastases from prostate cancer. There was
parallel rise in BSI and PSA in 24(105) patients treated for APIC with
hydrocortisone. In a group of 27 patients with limited bone disease of APIC the
BSI calculated was <3%. Moreover in a group of 21(62 scans) patients the
change in BSI as a function of time explored graphically. So it was concluded
that serial bone scan BSI appears capable of quantifying both the progression
of tumour involvement by tumour as well as response to treatment.
Later same BSI method
was used by Elizabeth et al. under the article named as ‘Bone Scan Index: A
quantitative treatment response biomarker for castration resistant metastatic
prostate cancer’. In which prognosis of survival was calculated. 88 patients
were scanned, 81 of whom have died. And were analysed using univariate and
bivariate analysis. It was analysed that a doubling in BSI resulted in a 1.9
fold increase in risk of death and was concluded as the On-treatment changes of
BSI are a response indicator and support further exploration of bone
scintigraphy as an image biomarker.
Bone scan index
represents the total skeletal mass which tumours take up [[120]], it is a valuable metric for estimating the
burden in patients with advanced prostate cancer. It is a reproducible and
quantitative expression of tumour burden seen on bone [[121]]. It also
act as prognostic tool in advanced prostate cancer. It is useful for
stratifying the carcinoma prostate patients entering treatment protocols for
the extent of the tumour involvement of the bone. It is also suggested for the
development of a treatment response biomarker in prostate cancer. There is also
an automated method for the calculation of %BSI, as Automated Quantification of
BSI based on the original method developed by ‘Memorial
Sloan-Kettering Cancer Center, New York, USA’. [[122]].The %BSI automated method is available
commercially. This has been developed by ‘EXINI Diagnostics AB’. Moreover it can
be calculated manually as Based on ICRP Publication No.23, 158 bones were
listed by name and the weight of each bone was expressed as a fraction of the
weight of the entire skeleton. The fractional involvement of each bone will be
calculated visually on each bone scan. BSI values can be obtained by summing
the product of the weight and the fractional involvement. So by designing a BSI
calculator in Microsoft excel such that the weight in grams of each bone is
multiplied with the percentage of the bone involvement and then is divided by
the total percentage of the respective bone i-e 100 % the percentage Bone scan
index can be obtained.
1.19.1.1
Utility
of %BSI in Advanced Prostate Cancer
The
bone scan index is highly beneficial in metastatic prostate cancer to calculate
the tumor burden moreover has significant role in estimating the prognosis of
this disease too.
1.19.1.2
%BSI
acts as Prognostic Tool in patients with Advanced Prostate Cancer
In high risk and
metastatic prostate cancer, BSI is associated with patients survival and
correlates with other biomarkers of disease burden while adding independent
prognostic information. The relationship between BSI and Predictive median
survival time (months) suggests that increased BSI is associated with decreased
survival [[123]].
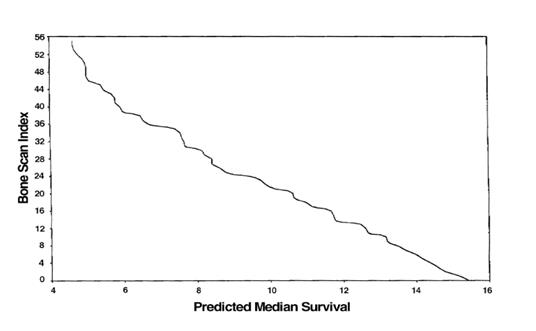
Figure 1.20: The relationship between BSI and Predictive median
survival time (months) [[124]]
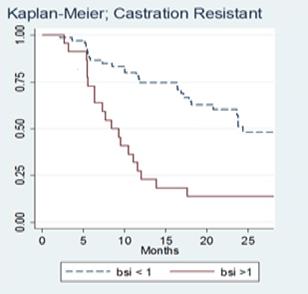
Figure 1.21: Rapid Disease progression in patients with BSI>1 than
with BSI<1 [[125]].
1.19.1.3
BSI
is Useful for Stratifying Patients with Prostate Cancer Entering Treatment Protocols
Patients stratified by
BSI differ significantly in disease severity, Disease progression rate and
survival. Overall survival probability is higher for the patients having
BSI<1 than for the patients with BSI<1. The broken line shows an age
matched control survival curve for patients without metastasis.
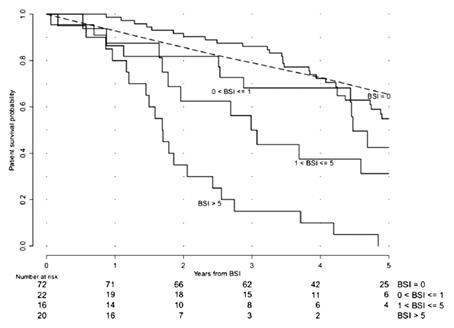
Figure 1.22: Overall survival probability is higher for the patients
having BSI<1 than with BSI<1 [[126]].
1.19.1.4
Response
Indication
BSI is suggested for the
development of treatment response indicator in prostate cancer. On-treatment
BSI change in BSI is demonstrated to be associated with overall survival in
patients with metastatic castration-resistant prostate cancer on
immunomodulator or chemotherapy.
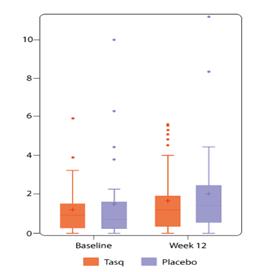
Figure 1.23: Patients on immunomodulator (Tasq) treatment showed a
slower BSI-increase than patients on the placebo [126]
1.19.2 Extent
Of Disease (Grading)
Similarly Extent of
Disease was also measured by using bone scans. The extent of disease is
basically based on the paper by [[127]].
The total numbers of lesions were determined by visual counting of each
discrete lesion. The metastatic findings on bone scans were classified into
four groups from Grade 1-4. Grade 1 is for the lesions less than six but single
vertebrae involvement is taken as 2 lesions, Grade 2 is for the lesions greater
than 6 but less than 20. Grade 3 is for the lesions greater than 20 but less
than super scan. Grade 4 is for the super scan in which whole skeleton is
involved diffusely.
Based on the
Extent of disease evidence based data by Soloway et al. 1988 [127], it has been
observed that EOD in correlation with the PSA acts a good prognostic factor for
calculating the tumour burden and altering the treatment based on these tools
along with other factors like alkaline phosphatase and clinical status of the patient.
And after calculating the results, disease progression or disease regression
can be commented upon by the number of lesions on the bone scan [[128]].
1.19.3 %PAB
(Positive area on bone scan) Method
Other method of
quantitation includes %PAB (Positive area on bone scan). It was
explained by M.Noguchi et al. [129] to provide simply a quantitative measure of
extent of disease on bone scan. All the positive regions on the bone scans were
transferred by tracing a comprehensive mss of the entire bone metastasis. These
findings were converted into image files using digitizing pad and drawing
programme (Mac Paints, Claris Corp., Santa Clara, CA, USA) with a Macintosh
computer (Apple, Inc., Cupertino, CA, USA). The sum of all positive areas was
automatically measured using an image analysis program (NIH Image developed and
maintained by the National Institutes of Health, Bethesda, MD, USA). The
fractional involvement of the entire skeleton by metastasis was estimated as
the %PABS. The %PABS was calculated using the formula %PABS= (positive area on
bone scan/square area) *100, in which the square area was multiplied by the
width at the gluteal region to the height of the entire skeleton on the bone
scan via this study it was concluded that the % PAB automatic software quantitation
is a simple and reproducible method to estimate the percentage of skeleton
involved in tumour. This method may be useful to stratify patients in clinical
trials and to provide prognostic information [[129]].
1.19.4 Bone
Lesion Scoring (BLS) Method
Bone Lesion Scoring is
another quantitation method that has been designed for calculating the tumour
burden by using bone scans of metastatic bone disease.
(Proposed by Prof. Guiliano Mariani, Universtiy di Pisa Italy, verbal
Communication).
1.20Use of Biochemical Markers
to Predict the Skeletal Morbidity and Clinical Outcome
Metastatic bone disease
results from the interactions between cancer cells in the bone marrow
microenvironment and normal bone cells. These growth factor and
cytokine-mediated interactions lead to stimulation of osteoclastic bone
resorption and both uncoupled and unbalanced bone remodelling. The effects of
cancer on bone cell function can now be assessed accurately by the measurement
of specific biochemical markers; for the assessment of bone resorption, these
markers are derived from the breakdown of type I collagen, the main protein of
bone. It is the result of this tumours-induced osteolysis and subsequent loss
of the structural integrity of bone that may lead to bone pain, fractures, and
other important skeletal complications, rather than stimulation of osteoblastic
new bone formation [[130]].
In other words, the resorptive element of the process largely drives the
clinical consequences. However, not all patients with bone metastases
experience significant complications, either because of dominant disease at
other sites dominating the clinical course or effective control of the skeletal
disease by local or systemic treatments. Recent studies indicate that risk of
skeletal complications in both breast and prostate cancer is strongly related
to the rate of bone resorption. Such events are uncommon when bone resorption
is normal but become increasingly frequent as the bone resorption rate
increases [[131]].
2
AIMS AND OBJECTIVES
Ø To
determine the utility bone scan quantitative parameters as disease status
indicator.
Ø To
compare four different bone scan quantitative parameters.
Ø To
evaluate quantitative bone parameters as prognostic indicator in prostate
cancer
3
MATERIALS AND METHODS
The study was conducted
at N.O.R.I (Nuclear Medicine Oncology and Radiotherapy Institute, Islamabad)
from October 2013 to April 2014. The synopsis was approved by P.I.E.A.S,
Ethical Review Committee N.O.R.I hospital.
Patient’s Demographic
Data:
Total 141 patients with
baseline bone scans were included in the study. The characteristics of the
study population are depicted in the table 3-1.
Table 3.5:
Patient's Demographic Data (Baseline bone scan)
|
Variable at Baseline
|
No. of Patients
|
%
|
Median
|
Range
|
|
Age, Years
|
|
141
|
|
75
|
24
|
|
PSA ng/ml
|
|
141
|
|
380
|
1236
|
|
Patient Status
|
Dead
|
21
|
14.89%
|
|
|
|
Alive
|
120
|
85.11%
|
|
|
The patients with both
baseline and follow up scans were 40 in total with median age of 77 and median
PSA level of 200. The demographic data is given in the table 3-2.
Table 3.6:
Patient's Demographic Data (Baseline and follow up scans)
|
Variable at Baseline
|
No. of Patients
|
%
|
Median
|
Range
|
|
Age, Years
|
|
40
|
|
77
|
23
|
|
PSA ng/ml
|
|
40
|
|
200
|
1614
|
|
Patient Status
|
Dead
|
13
|
32.50%
|
|
|
|
Alive
|
27
|
67.50%
|
|
|
—
Study design: Cross Sectional Study.
—
Place of study: Nuclear Medicine
department of NORI
—
Duration: Six months.
—
Sampling Method: Non probability
purposive sampling method
—
Sample size: 141 Patients with
histopathologically proved Prostate Cancer.
(Baseline and Follow up scan of 40 patients
with hormonal treatment).
Sample Selection:
Inclusion Criterion:
Ø Histological
confirmed prostate cancer patients referred for evaluation of osseous
metastasis within three months of diagnosis.
Ø Written
informed consent.
Exclusion Criterion:
Ø <
18 years.
Ø Patients
in which PSA levels was not available
Ø Patients
having other co-morbids.
Every patient included in
our study underwent Bone Scintigraphy and later the quantitative parameters
were applied on the bone scan.
We have applied different
methods of quantitative parameters for the assessment of tumour burden on the
bone scan baseline and follow up bones can. These methods include:
% BSI (Bone Scan Index).
Extent of Disease (EOD)
%PAB (Positive areas on bone scan).
Bone Lesion Scoring (BLS) Method.
3.1
Bone Scintigraphy
Whole
body images were acquired on dual head gamma camera (GE infinia camera with
Xeleris2 workstation) simultaneously in both anterior and posterior projections
at 4 hours after the radiopharmaceutical injection. The radiopharmaceutical
used for bone scintigraphy was 99mTc-MDP (Methylene Diphosphonate).
2
3
3.1
3.1.1
Radiopharmaceutical & its Preparation
Freshly eluted 99mTc-pertechnetate from 99Mo-99mTc
generator (Pakgen-IPD, PINSTECH) was used for labelling of MDP for bone
scintigraphy. Each study was performed using 99mTc-MDP, obtained from GE
Healthcare Limited, UK. Every vial contained 10mL multidose vial contains:
Medronic acid: 20 mg, Ascorbic acid: 1 mg, Stannous fluoride, SnF2: 0.13 mg
(minimum), Total tin (maximum, as stannous fluoride, SnF2): 0.38 mg. The pH was
adjusted to 6.5 (6.3 to 6.7) with sodium hydroxide and/or hydrochloric acid
prior to lyophilization. No bacteriostatic preservative was present in the
vial. The contents of the vial are lyophilized and sealed under nitrogen at the
time of manufacture.
3.1.2
Quality Control
It
includes Quality Control (QC) of radioisotope as well as radiopharmaceutical.
3.1.3
Quality Control of
Radioisotope
QC
of radioisotope mainly accounts for testing the aluminium content in freshly
eluted 99mTc-pertechnetate and also for testing any 99Mo
breakthrough.
3.1.4
99Mo Breakthrough
It
was tested by setting the window of dose calibrator for 99mTc, and
recording the reading for the fresh elute obtained from 99Mo-99mTc
generator. Then dose calibrator window was set for 99Mo and same
vial was placed in 99Mo breakthrough shield to check 99Mo
breakthrough activity. Maximum upper limit for the 99Mo activity is
1 µCi/mCi [[132]]
of 99mTc at the time of elution. Fresh elutes were only used for
studies when Al contents and 99Mo breakthrough were within permissible
limits.
3.1.5
Quality Control of
Radiopharmaceutical
The
quality control of radiopharmaceutical was done by Instant Thin Layer
Chromatography (ITLC).
3.1.5.1 Equipment and
Eluent
- ITLC/SG
strip (2cm × 15 cm)
- Ascending
Chromatography tank and cover.
- 35:65
v/v mixture of acetone and dichloromethane.
- Insulin
syringe.
- NaI
Detector.
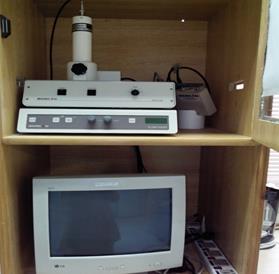
Figure 3. 1
Quality control of kits using ITLC
Procedure
- 35:65
acetones: chloromethane mixture was poured into the chromatography tank to
the depth of 1cm and the tank was covered to allow the solvent vapour to
equilibrate.
- ITLC/SG
strip was marked with a pencil line at 2cm from the bottom and, using an
ink marker pen, at 12cm from the pencil line.
- 10-20µl
sample of prepared injection was applied at the origin of strip with the
help of insulin syringe. The strip was placed in the chromatography tank
immediately and the cover was replaced.
- When
the solvent reached the ink line, the strip was removed from the tank and
dried.
- The
strip was placed on aluminium plate and tapped to prevent moving around
during the scan.
- Aluminium
plate was placed in the mini-scan tray and the tray was pushed slowly so
that top of the plate lines up with edge of the collar.
- External
controlling panel device was started by pressing “start” to begin scan.
- When
data collection was completed, CHROMATOGRAM was integrated using
CHROMATOLITE software and the results were saved.
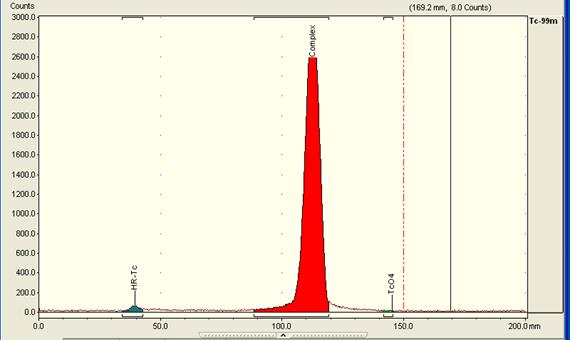
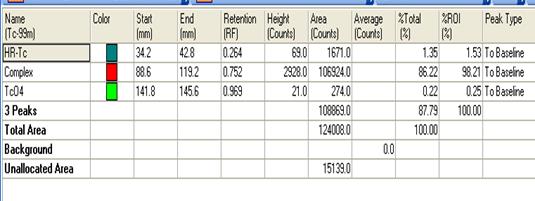
Figure 3.2:
Chromatogram showing % of Tc-MDP
3.1.6
Quality Control of Gamma Camera
Quality
control for planar systems like gamma camera was based on measurement of system
uniformity and resolution on a daily and weekly basis respectively. Additional,
but less frequently performed QC measurements include checks of collimator
integrity, multiple window spatial registration and for some systems, whole
body uniformity. The uniformity of gamma camera was checked daily using Tc 99m
point source placed at a distance of four times the detector field of view.
Measurement of linearity and resolution was generally performed on weekly
basis.
3.1.7
Patient Preparation and Procedure
Whole
procedure was explained to the patients regarding bone scintigraphy and unless
any contraindication patients were well hydrated and were instructed to drink
two or 8 oz glasses of water between the time of injection and the time for delayed
imaging. The patients were directed to micturate immediately before delayed
image and were directed to drink plenty of water for at least 24 hours of
radiopharmaceutical administration.
3.1.7.1 Radiation
Dosimetry in Adults
The dose for the bone scintigraphy is given in the
table 3-3.
Table 3.7:
Radiation dosimetry in adults [[133]]
|
Radiopharmaceutical
|
Administered Activity
MBq (mci)
|
Organ Receiving the
Largest Radiation Dose mGy/MBq (rad/mCi)
|
Effective Dose mSv/MBq
(rem/mCi)
|
|
99mTc-Phosphates
and Phosphonates
|
740-1110
(20 - 30) Intravenously
|
Bone
0.063 (0.23)
|
0.008
(0.03)
|
Following quantitative
parameters were applied on the bone scans:
3.1.8
%BSI (Bone Scan Index) Method
%BSI
is one of the most frequently used quantitation method and is also available as
commercial software. Based on ICRP Publication No.23 [134], 158 bones were
listed by name and the weight of each bone was expressed as a fraction of the
weight of the entire skeleton. The fractional involvement of each bone was
calculated subjectively on each bone scan. BSI was calculated by summing the
product of the weight and the fractional involvement. So it has been carried
out manually by designing a BSI calculator in Microsoft excel such that the
weight in grams of each bone is multiplied with the percentage of the bone
involvement and then is divided by the total percentage of the respective bone
i-e 100 %.
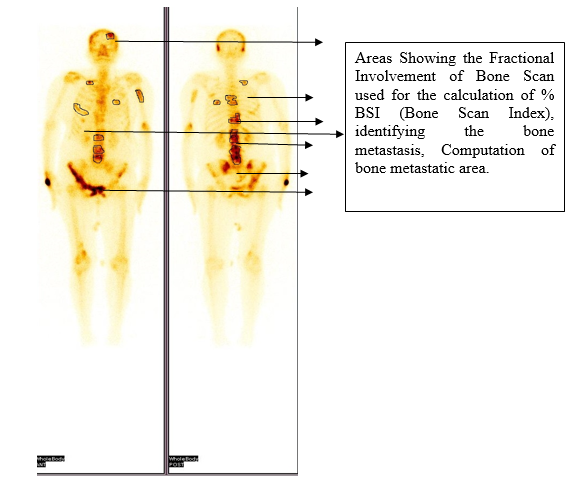
Figure 3. 3
Fractional involvement of bone due to metastasis and BSI calculation
Formula
Used:
 =
ABC (Grams)
=
ABC (Grams)

Total Weight Male = 5500gms
%
of total fresh skeletal mass in grams used for calculation is shown in the
table below [ICRP-23] [[134]].
Table 3.8:
Percentage of Total Fresh Skeletal Mass in Grams [134]
|
Regions
|
Weight in Grams
|
%age weight
|
|
Head: Skull
|
649
|
11.80%
|
|
Mandible
|
66
|
1.20%
|
|
Trunk: Vertebrae + Sacrum
|
66
|
1.20%
|
|
Ribs
|
385
|
7.00%
|
|
Sternum
|
66
|
1.20%
|
|
Limbs: Femora
|
842
|
15.30%
|
|
Tibiba & Fibula
|
622
|
11.30%
|
|
Pelvic Bones
|
583
|
10.60%
|
|
Feet
|
346
|
6.29%
|
|
Humeri
|
292
|
5.30%
|
|
Radii & Ulana
|
198
|
3.60%
|
|
Scapula
|
198
|
3.60%
|
|
Hands
|
127
|
2.30%
|
|
Clavicle
|
44
|
0.80%
|
|
Patella
|
39
|
0.70%
|
This
method of quantitation was applied to 141 patient’s baseline scan and also to
40 patients with both the baseline and follow up scans. Value of 1 was used as
cut off, below that patients were considered low risk for disease progression
and above that were considered as high risk for disease progression. This value
was chosen based on the previously published study in which the cut off was
used for the purpose of calculation [125, 126].
3.1.9
Extent of Disease (EOD) -Grading
This
method of quantitation is based on the subjective assessment of osseous
metastasis on the bone scan the number of osseous metastasis is labelled as a
specific grade, grade 0 means no evidence of bone metastasis, and grade 1 to 4
represents increasing osseous metastasis respectively as mentioned in table
3-4.
Table 3.9:
Extent of disease (Grading)
|
Grade
|
Extent
of Disease
|
|
Grade -0
|
No Metastasis
|
|
Grade- 1
|
< 6 Bone Mets, Vertebral Body = 2
|
|
Grade-2
|
6-20 Bone Mets
|
|
Grade-3
|
> 20 Bone Mets but < Super Scan
|
|
Grade-4
|
Super Scan
|
The method of calculating
‘Extent of Disease’ is subjective assessment of bone metastasis on skeletal
scintigraphy. The number of lesions determines the extent of disease as
explained in the table above. The arbitrary cut off for the purpose of
quantitation and analysis of survival was taken as grade 0&1 and grade 2,
3&4. The patients with grade 0&1 were considered low risk whereas those
with grade 2, 3&4 were considered high risk. Soloway et. al used the same
method for the bone metastasis quantitation and survival analysis [125, 126]. Extent
of Disease- Grading was calculated as:
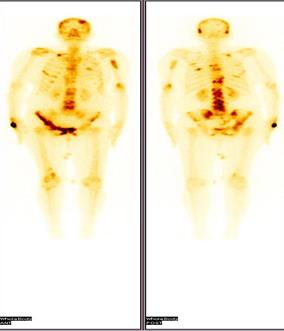
Figure 3.4
Scan showing multiple metastasis in the region of skull, spine, pelvis and long
bones
3.1.10
%PAB (Positive area on bone scan)
Positive
area on bone scan is a quantitative method in which the osseous metastasis is
considered as the positive area. The same method was applied to the dataset of
patients using the formula given below:

In
this method the involved areas on the bone scan of a patient were measured
using the computer software and are summed up; used as a numerator as mentioned
in the above formula, whereas using the same software the width of the hip bone
and the height of the skeleton was measured on the same bone scan; using as a
denominator as per mentioned in formula and finally the percentage was calculated.
The arbitrary cut off for %PAB method was taken as 0.5.The patients with %PAB
above this cut off values were considered high risk as compared to the dataset
of patients having % PAB values below this cut off. M. Nogouchi et. al used the
same method of %PAB for osseous metastasis quantitation and survival analysis
[129]. % PAB Calculation was calculated using following steps using computer software.
Step
1:
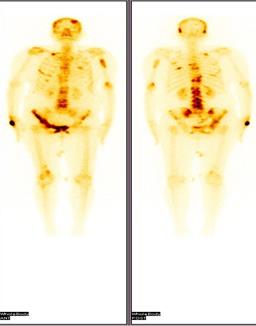
Step-2:
Calculating the Positive Area on Bone Scan:
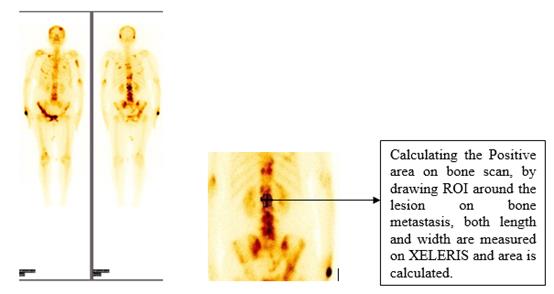
Step-3: Calculating
the height of the Skeleton along with the width from the gluteal region on the
Scan using same XELERIS software in mm units. (The Height is taken from vertex
till heel of the skeleton whereas the width is calculated using the bilateral
anterior superior ileac spine)
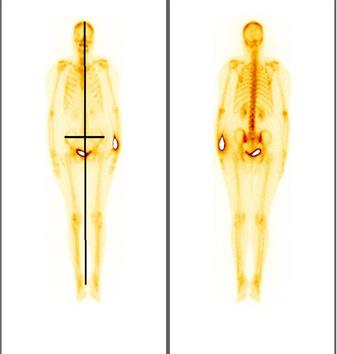
Step-4:
Calculating the % PAB of the Scan by Applying the Formula:

3.1.11 Bone
Lesion Scoring
The bone lesion scoring
is also a subjective method in which numbers of lesions are assessed clinically
at different regions of the skeleton and is then summed up to find out the
exact scoring of the scan (Proposed by Prof. Guiliano Mariani, Universtiy di
Pisa Italy, verbal Communication).The following regions have been given score
as shown in the table below:
Table 3.10: Bone Lesion Scoring
|
Scoring
|
Skull Metastasis
|
Spine Metastasis
|
Pelvis
|
Thorax
|
Extremities
|
|
0
|
No Mets
|
No Mets
|
No Mets
|
No Mets
|
No Mets
|
|
1
|
< or = 2
|
< or = 2
|
< or = 10%
|
< or = 2
|
< or = 2
|
|
2
|
>2
|
3 to 5
|
10-25%
|
3 to 5
|
3 to 5
|
|
3
|
-
|
>5
|
>25%
|
>5
|
>5
|
The cut off for BLS was taken arbitrarily as 5 for the purpose of survival
analysis and prognosis evaluation. The patients with baseline bone scan bone
lesion scoring (BLS) >5 were considered as high risk whereas those with BLS
< 5 were considered low risk.
Calculating Bone Lesion Scoring:
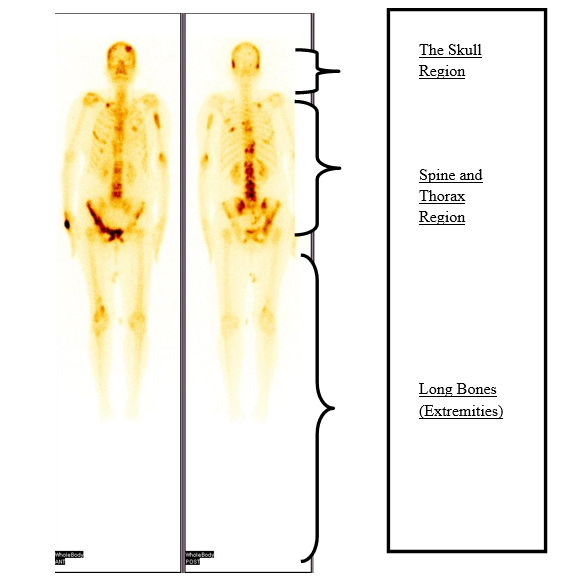
Figure 3.5
Fractional involvement of bone due to metastasis and BSI calculation
3.2
Statistical Analysis
Mean values, median,
mode, standard deviation and sample variance of all available quantitative
parameters were calculated. For determination of relationship between
quantitative parameters (%BSI, %PAB, EOD, BLS) and PSA, R^2 correlations
(Linear regression analysis) were applied separately on each parameter
according to which the value of ‘R^2’ if near to ‘1’ shows that the model is
best fitted such that the variables are showing the direct relationship. Regression
analysis was used for the testing of the data. Bar charts were generated for
the graphical representation of data.
For data set of baseline
and follow up scans, the progression or regression was explained using bar
charts with pre-set cut off values. Moreover Kaplan Meir survival curves SPSS
between variable of interest were generated to see the prognostic significance
of each quantitative parameter.
.
4 RESULTS
4.1
Descriptive Statistics
Total
141 patients having bone scans within three months of diagnosis were included.
The mean age of the data set was 75 years.
Table 4.1 Demographic data of Patients with baseline bone scans
|
Variable at Baseline
|
No. of Patients
|
%
|
Median
|
Range
|
|
Age, Years
|
|
141
|
|
75
|
24
|
|
PSA ng/ml
|
|
141
|
|
380
|
1236
|
|
Patient Status
|
Dead
|
21
|
14.89%
|
|
|
|
Alive
|
120
|
85.11%
|
|
|
|
Bone Pains
|
Positive
|
130
|
|
|
|
|
Negative
|
11
|
|
|
|
|
Treatment
|
Surgical
|
57
|
|
|
|
|
Non-Surgical
|
84
|
|
|
|
|
Gleason Score
|
|
141
|
|
8
|
5-10
|
Similarly
the demographic data of patients with both baseline and follow scans is
represented in the table below
Table 4.2 Demographic data of baseline and follow up scans
|
Variable at Baseline
|
No. of Patients
|
%
|
Median
|
Range
|
|
Age, Years
|
|
40
|
|
77
|
23
|
|
PSA ng/ml
|
|
40
|
|
200
|
1614
|
|
Patient Status
|
Dead
|
13
|
32.50%
|
|
|
|
Alive
|
27
|
67.50%
|
|
|
|
Bone Pains
|
Positive
|
29
|
|
|
|
|
Negative
|
11
|
|
|
|
|
Treatment
|
Surgical
|
Nil
|
|
|
|
|
Non-Surgical
|
40
|
|
|
|
|
Gleason Score
|
|
40
|
|
9
|
6-10
|
Four
quantitative parameters were applied on the baseline scans of the patients. The
characteristics of which has been described below in table 4-3.
Table 4.3 Descriptive statistics
|
|
BSI
|
PAB
|
EOD
|
BLS
|
PSA
|
|
Mean
|
2.9
|
0.8
|
1.3
|
5.1
|
612
|
|
Standard Error
|
0.3
|
0.1
|
0.0453806
|
0.2
|
99
|
|
Median
|
1.8
|
0.6
|
1
|
5
|
380
|
|
Mode
|
0.6
|
1.0
|
1
|
4
|
450
|
|
Standard Deviation
|
4.0
|
1.2
|
0.5
|
2.7
|
1180
|
|
Sample Variance
|
16
|
1.4
|
0.2
|
7.3
|
1393330
|
|
Kurtosis
|
24
|
35.7
|
4.8
|
1.1
|
53
|
|
Skewness
|
4.4
|
5.4
|
2.0
|
0.8
|
7
|
|
Range
|
28
|
9.4
|
3
|
13
|
11236
|
|
Minimum
|
0.1
|
0.04
|
1
|
1
|
0.02
|
|
Maximum
|
29
|
9.4
|
4
|
14
|
11236
|
|
Sum
|
412.1
|
122.7
|
181
|
731
|
86306
|
|
Count
|
141
|
141
|
141
|
141
|
141
|
Descriptive
statistics was used to check the variables mean, standard deviation, lowest and
extreme values of the data. It statistically explained the population under
study.
The
patient’s age ranges between 60 years -85 years in our study population with
the mean age of 75 years. It can be represented via Bar chart as follows:
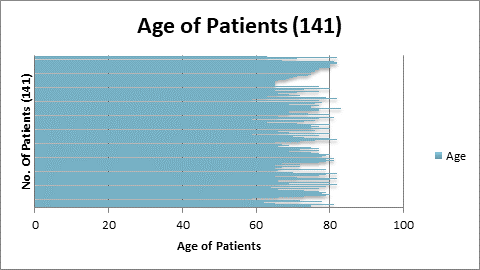
Figure 4.1:
Age of Patients
4.2
Comparing % BSI Quantitation Method with PSA Levels
By
applying correlation statistics (goodness of fit model) we compared the
relationship of %BSI and PSA levels.
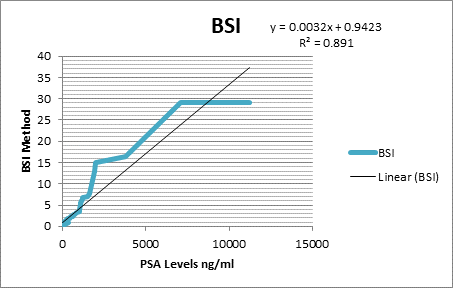
Figure 4.2:
BSI vs PSA
Equation derived from the
graph:
Y = α
+ βXt
+ µt
Y = 0.0032x + 0.9423
Where
Y is the dependent Variable i.e. BSI. PSA is the independent or explanatory
variable. X is the slope/beta which shows the rate of the change in the
variable. Alpha i.e. constant 0.9423 is the intercept. µt is the error term.
R^2
Goodness and fitness of the Model.
If
R^2 value is near to 1 or equal to 1 it shows that model is best fitted. Here
R^2 value is 0.891 which shows the goodness of the model. This shows that as
the PSA level increases the %BSI quantitation values also increases, showing
the linear relationship between the dependent and independent variables. Thus
proving the linear relationship between the BSI and PSA levels.
The
% BSI values of the data set can be represented via bar diagram as:
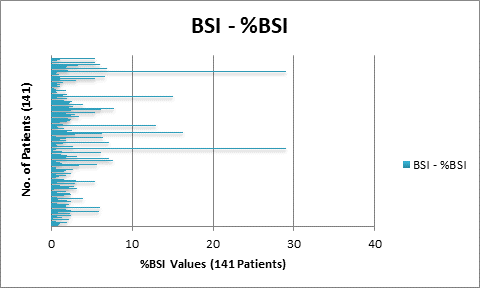
Figure 4.3:
%BSI Range via Bar Diagram.
4.3
Comparing %PAB Quantitation Method with PSA Levels
Similarly
correlation statistics was also applied on the %PAB quantitation method
and PSA levels to see the relationship between the two variables.
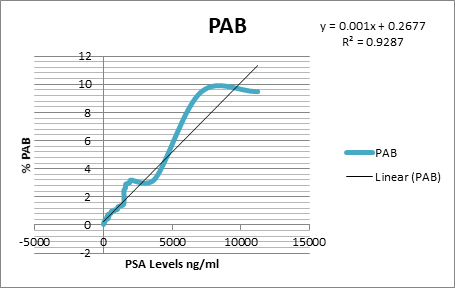
Figure 4.4:
%PAB vs PSA Levels.
Equation derived from the
graph:
Y = α
+ βXt
+ µt
Y = 0.001x + 0.2677
Here
R^2 value is 0.9287 which shows excellent linear correlation between %PAB and
PSA levels , concluding the linear increase in quantitative values of the %PAB
method with PSA levels.Bar diagram representing the %PAB values of the data set
is shown below:
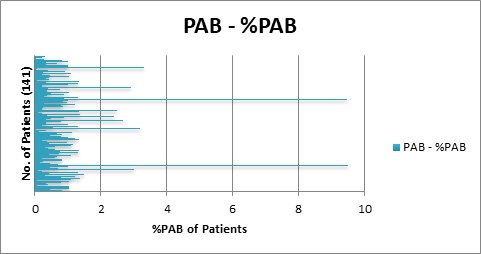
Figure 4.5:
%PAB Range via Bar Diagram.
4.4
Comparing EOD Quantitation Method with PSA Levels
The
EOD method of quantitation was compared with PSA levels by using correlation
statistics to see the response and general trend of the two variables.
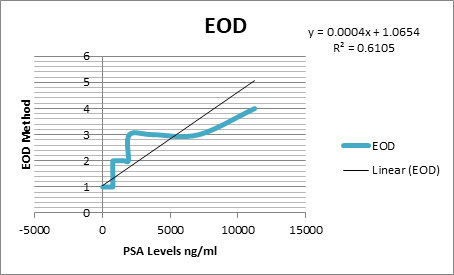
Figure 4.6:
EOD vs PSA Levels.
Equation derived from the
graph:
Y = α
+ βXt
+ µt
Y = 0.0004x +
1.0654
R^2 Goodness and fitness
of the Model.
Hence
it can be concluded PSA level shows variability with extent of disease
quantitation method (R^2 0.6105), so it was observed that as the PSA level
increases the quantitative method values did not increases linearly.
Data
set with their respective EOD values can be represented via Bar diagram as
shown below, representing that the maximum bulk of patients were having grade
0, 1and 2 extent of disease with few showing grade 3 and 4.
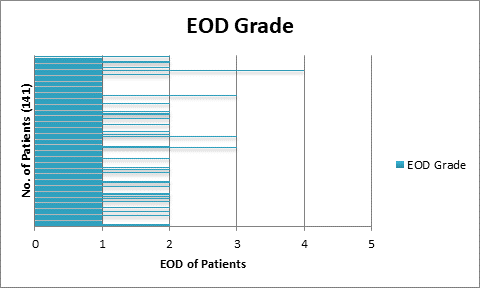
Figure 4.7:
EOD Range via Bar Diagram.
4.5
Comparing BLS Quantitation Method with PSA Levels
Correlation
statistics was applied to see the relationship between BLS quantitation method
and PSA levels as mentioned in the figure below.
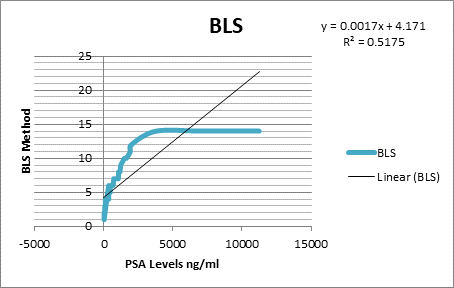
Figure 4.8:
BLS vs PSA Levels.
Equation derived from the
graph:
Y = α
+ βXt
+ µt
Y = 0.0017x +
4.171
R^2
value was calculated as 0.5175. Hence it can be concluded from the R^2 value
that the increasing BLS quantitation method shows variability with the rising
PSA levels. This means there is not good linear correlation between BLS
quantitation method and PSA levels. So BLS quantitation method did not
translate the similar picture as other quantitative methods showed with PSA
levels.
We
have applied this method of quantitation on 141 scans; the data can be
represented using Bar chart, showing the BLS Method value in every patient.
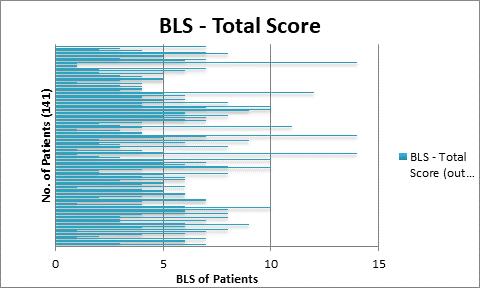
Figure 4.9:
BLS Range via Bar Diagram.
As
we applied quantitation methods on the baseline scans of 141 patients and later
correlated them with the PSA Levels. So PSA levels of the whole population
under consideration can be represented as follows using bar chart as:
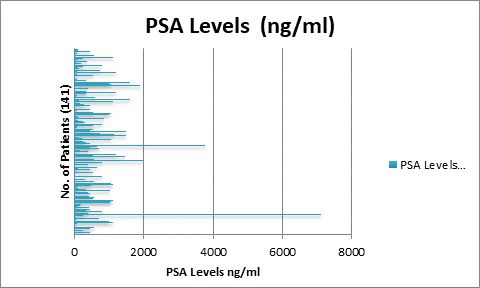
Figure 4.10: Representing PSA Levels on Data
.
4.6
Regression Analysis
By applying the OLS regression analysis we get the
following statistics of our data.
Table 4.4 Regression Analysis
|
Dependent Variable: PSA
|
|
Method: Least Squares
|
|
|
Sample: 141
|
|
|
Included observations: 141
|
Variable
|
Coefficient
|
Std. Error
|
t-Statistic
|
Prob.
|
|
|
|
|
|
|
PAB
|
-126.81
|
100.45
|
-1.26
|
0.20
|
|
EOD
|
509.54
|
255.69
|
1.99
|
0.04
|
|
BSI
|
-44.16
|
38.66
|
-1.14
|
0.25
|
|
BLS
|
91.52
|
63.73
|
1.43
|
0.15
|
|
R-squared
|
0.06
|
Mean dependent var
|
|
612.09
|
|
Adjusted R-squared
|
0.04
|
S.D. dependent var
|
|
1180.39
|
|
S.E. of regression
|
1156.12
|
Akaike info criterion
|
|
16.97
|
|
Sum squared resid
|
1.82E+08
|
Schwarz criterion
|
|
17.08
|
|
Log likelihood
|
-1191.97
|
Hannan-Quinn criter.
|
|
17.02
|
|
F-statistic
|
2.48
|
Durbin-Watson stat
|
|
1.95
|
|
Prob(F-statistic)
|
0.04
|
|
|
|
R
square is the goodness and fitness of the model. It was calculated as:
Estimated Sum of squares/ Total sum of squares. Its range lies between 0
≤ r square ≤ 1. Here R square is 0.068101 of all available
quantitative parameters collectively. This shows that our methods are overall
significant in calculating the tumor burden with reference to the PSA levels.
Prob
(F-statistic): The overall model was significant at 5% confidence level
because it was calculated as 0.046522 which was less than 0.05 i.e. which
shows that the variable EOD, BLS %BSI and %PAB describes variations in the
PSA. As PSA is increasing the variables BSI, EOD, BLS, PAB are increasing
showing the increasing trend i-e when the quantitation methods values were increased
the corresponding PSA levels also showed increasing trend favoring the
increase in the tumor burden.
T
statistics shows the significance of individual independent variables. The
range of the T-statistics is between -1.96 to +1.96. Keeping in view the OLS
regression analysis as calculated above t is can be observed that %PAB, %BSI
and BLS shows the values within the specific range, so in case of %PAB it is
– 1.262411, for %BSI it’s found to be -1.14243 and for BLS it’s found to be
1.435927, which is within the range of -1.96 to +1.96, showing the
significance of the methods with respect to the PSA levels. Proving the fact
that as the PSA level is high the tumor burden quantitation is also increased
with relevance to the PSA levels But the t-test of EOD (Extent of Disease)
shows the value of 1.992801 which is out of the required range, showing that
this quantitation did not corresponds with the PSA levels.
|
4.7
Analysis of Baseline and Follow up Scan in Dead v/s Alive Patients using
four Quantitative Parameters
The baseline and follow up scans were analyzed by
using quantitative parameters as follows:
4.7.1
Extent of Disease in Baseline and Follow up Scan and Effect on
Survival
The
EOD was applied to the baseline and follow up scans of the 40 patients. It was
observed that the patients with the increase in tumour burden in follow up
scans died whereas the patients with tumour burden in follow up scans showed
better survival. It can be represented as shown in the table below.
Table 4.5 Effect of EOD calculations in Baseline and Follow up scans
|
Status at the end of
Follow up
|
A > B
(A:Baseline Scan,
B:Followup
scan)
|
B > A
(A: Baseline Scan,
B:
Follow up scan)
|
Grand Total
|
|
Alive
|
27
|
0
|
27
|
|
Dead
|
5
|
8
|
13
|
|
Grand Total
|
32
|
8
|
40
|
The
‘A’ represents the tumour burden (EOD) on baseline bone scan whereas the
‘B’represents the tumour burden (EOD) on follow up bone scans. By comparing the
baseline and follow up scan with the extent of disease it has been observed
that as the tumour burden increases in follow up scans there is less chances of
the survival of a patient. By this method we conclude from above table that out
of 13 dead patients this method significantly tells the rate of decrease
survival i.e. 61.53 %
By
using the cut off of grade 0&1 and grade 2, 3 & 4.It was further
observed that the patients with the increase in tumour burden specifically with
EOD-Grade2, 3 & 4 in follow up scans died as compared to the patients with
tumour burden with EOD-Grade 0&1 in follow up scans. It can be represented
via bar diagram as:
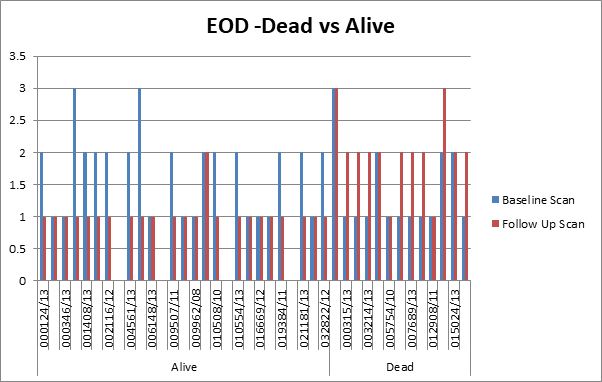
Figure 4.11: EOD- Dead vs Alive.
As
shown in the above diagram the patients with the increased tumour burden
EOD-grade 2, 3&4 after treatment in the follow up scans (red bars) died
where as the patients with less tumour burden EOD-0 &1 after treatment in
the follow up scans (Red bars) showed good survival.
4.7.2
Bone Lesion Scoring in Baseline and Follow up Scan and its Effect
on Survival
The
quantitative parameter of BLS was applied to the data set of 40 patients. The
patients with the increase tumour burden on follow up scans after treatment
showed bad response to the treatment and ultimately death. Whereas it has been
observed that the patients with the decrease tumour burden on follow up scans
showed good survival and better treatment response.
Table 4.6 Effect of bone lesion scoring in baseline and follow up
scans
|
Status at the end of
Follow up
|
A > B
(A:Baseline Scan,
B:Followup
scan)
|
B > A
(A: Baseline Scan,
B:
Follow up scan)
|
Grand Total
|
|
Alive
|
26
|
1
|
27
|
|
Dead
|
1
|
12
|
13
|
|
Grand Total
|
27
|
13
|
40
|
The
‘A’ represents the tumour burden BLS on baseline bone scan whereas the
‘B’represents the tumour burden on follow up bone scan. By comparing the tumour
burden via BLS quantitative parameter on baseline and follow up scans it has
been observed that as the tumour burden increases in follow up scans there was
less chances of the survival of a patient and thus showing treatment response
failure i-e 92.3 %. Furthermore by using the cut off of 5 in BLS method it has
been observed that the patients with the BLS values >5 on follow up scans
after treatment showed bad response to the treatment and ultimately death.
Whereas the patients with the BLS values <5 showed good survival and better
treatment response. It can be represented via bar diagram as:
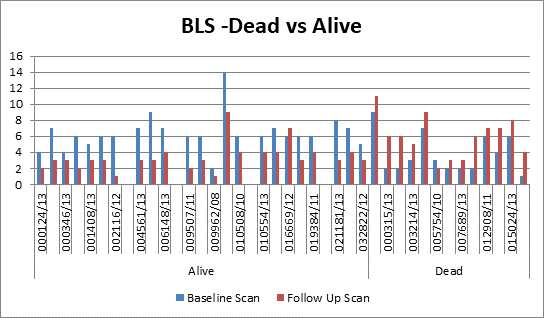
Figure 4.12: BLS- Dead vs. Alive
From
the bar diagram it was concluded that in data of alive patients (shown on the
left extreme side) the tumour burden as calculated via BLS method, was more in
the baseline scan (represented as blue bars) which later after treatment,
decreases (BLS <5) in the follow up scan (represented as red bars)
suggesting increase in survival of these patients. Whereas the extreme right of
the bar diagram shows dead patients data suggesting that the baseline scan
calculated tumour burden (represented as blue bars) did not improve after
treatment showing increase in tumour burden BLS >5 (represented as red bars)
thus showing the treatment failure and ultimately death.
4.7.3
% BSI in Baseline and Follow up Scan and its Effect on Survival
The
% BSI quantitative method was applied on the baseline and follow up scans of
the patients. It has been observed that the patients with the grater tumour
burden on follow up scans showed bad survival in comparison with the ones
showing less tumour burden. It is represented in the table given below.
Table 4.7 Effect of % BSI calculation in Baseline and follow up scans
|
Status at the end of
Follow up
|
A > B
(A:Baseline Scan,
B:Followup
scan)
|
B > A
(A: Baseline Scan,
B:
Follow up scan)
|
Grand Total
|
|
Alive
|
24
|
3
|
27
|
|
Dead
|
0
|
13
|
13
|
|
Grand
Total
|
24
|
16
|
40
|
The
‘A’ represents the tumour burden on baseline bone scan whereas the
‘B’represents the tumour burden on follow up bone scan. By comparing the
baseline and follow up scan with the bone scan index (%BSI method) it has been
observed that as the tumour burden increases in follow up scans after
treatment there was less chances of the survival of a patient. By this method
we conclude from above table that out of 13 dead patients this method
accurately tells that there is almost no chance of patient survival 100 % dead.
It
was furthermore observed that by taking the cut off of 1, the patient’s follow
up scan showing the tumour burden of %BSI >1 showed poor survival as
compared to the patient’s follow up scans with cut off values <1 as shown in
the bar diagram below.
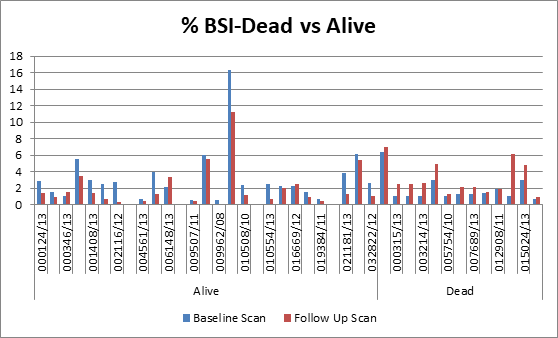
Figure 4.13: %BSI-Dead vs Alive.
It
has been observed from the bar diagram that in data of alive patients (shown on
the left extreme side) the tumour burden as calculated via %BSI method, was
more in the baseline scan (represented as blue bars) which later after
treatment, decreases in the follow up scan (represented as red bars) suggesting
good response to the treatment and thus increase survival of these patients.
Whereas the extreme right of the bar diagram shows dead patients data
suggesting that the baseline scan calculated tumour burden (represented as blue
bars) did not improve after treatment showing increase in tumour burden with
%BSI >1 (represented as red bars) thus showing the treatment failure and
less survival.
4.7.4
%PAB in Baseline and Follow up Scan and its Effect on Survival
Similarly
the %PAB quantitative parameter was applied on the baseline and follow up scans
of 40 patients. It was observed that increase in the tumour burden % PAB on the
follow up scans after treatment is a bad prognostic factor.
Table 4.8 Effect of % PAB calculation in Baseline and follow up scans
|
Status at the end of
Follow up
|
A > B
(A:Baseline Scan,
B:Followup
scan)
|
B > A
(A: Baseline Scan,
B:
Follow up scan)
|
Grand Total
|
|
Alive
|
25
|
2
|
27
|
|
Dead
|
1
|
12
|
13
|
|
Grand Total
|
26
|
14
|
40
|
The
‘A’ represents the tumour burden on baseline bone scan whereas the
‘B’represents the tumour burden on the follow up bone scan. By comparing the tumour
burden on baseline and follow up scan with the %PAB( Positive area on bone
scan) it has been observed that as the tumour burden increases in follow up
scans there is less chances of the survival of a patient. By this method we
conclude from above table that out of 13 dead patients this method
significantly tells the rate of decrease survival i-e 92.3 %.
Furthermore
by taking the cut off of 0.5, it was observed that the patients with tumour
burden > 0.5 in follow up bone scans showed treatment failure and disease
progression as compared to the patients with the less tumour burden %PAB value
of <0.5. It can be represented via bar diagram as:
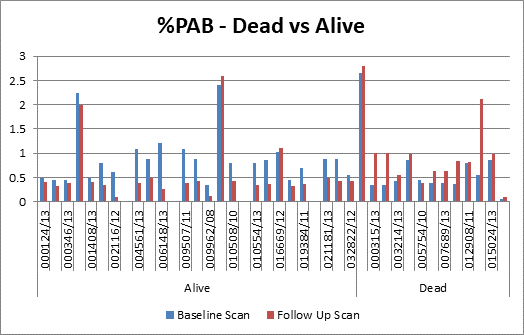
Figure 4.14: % PAB-Dead vs Alive.
It
has been observed from the bar diagram that in data of alive patients (shown on
the left extreme side) the tumour burden as calculated via %PAB method, was
more in the baseline scan (represented as blue bars) which later after
treatment, decreases in the follow up scan (represented as red bars) suggesting
increase in survival of these patients. Whereas the extreme right of the bar
diagram shows dead patients data suggesting that the baseline scan calculated
tumour burden (represented as blue bars) did not improve after treatment
showing increase in tumour burden >%PAB >0.5 (represented as red bars)
thus showing the treatment failure and less survival.
4.7.5
PSA Levels Correlation with Tumor Burden in Baseline and
follow-up Scan and its Effect on Survival
Table 4.9 PSA correlation
with tumour burden on serial scans
|
Status at the end of
Follow up
|
A > B
(A:Baseline Scan,
B:Followup
scan)
|
B > A
(A: Baseline Scan,
B:
Follow up scan)
|
Grand Total
|
|
Alive
|
26
|
1
|
27
|
|
Dead
|
0
|
13
|
13
|
|
Grand Total
|
26
|
14
|
40
|
The
‘A’ represents PSA values of the baseline bone scan whereas the ‘B’represents
the PSA values of the follow up bone scan. By comparing the PSA levels of baseline
and follow up scans it has been observed that as the tumour burden increases in
follow up scans the PSA levels also increases showing less chances of the
survival of a patient. So we conclude from above table that out of 13 dead
patients, the increase in PSA levels in the follow up scans accurately tells
that there is almost no chance of patient survival 100 % dead.
4.7.6
Correlation of PSA Levels in Both Baseline and Follow up Scans
of Alive and Dead Patients with all Four Quantitative Parameters
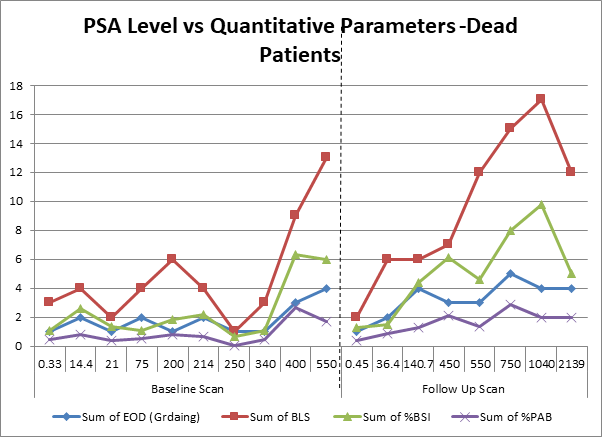
Figure 4.15: PSA Level vs Quantitative Parameters (In Dead Patients)
From
the above line diagram the general trend of all the quantitative parameters
with respect to PSA levels are very obvious in dead patients. It is observed
that the baseline bone scans have low values as compared to the follow up scans
(extreme right sided) which are calculated after treatment. Moreover the PSA
levels taken during the follow up bone scan also shows marked increase relative
to the PSA levels taken before baseline bone scans, signifying that increase in
PSA levels in follow up scan and a similar trend of increase values of all the
four quantitative parameters results in increase risk and decrease survival of
the patient.
Similarly
following observation was made in the baseline and follow up scans of patients
who were alive:
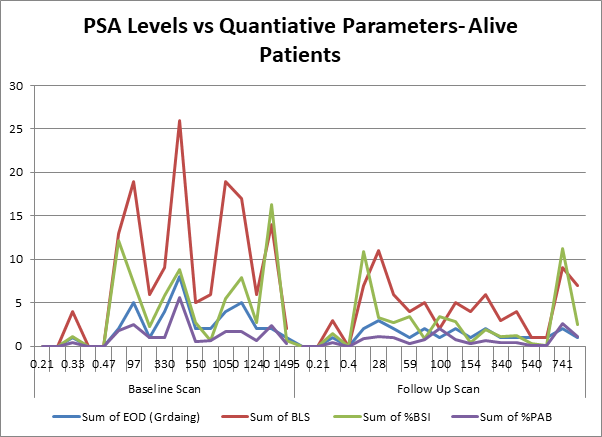
Figure 4.16: PSA Level vs Quantitative Parameters (In alive patients).
From
the above line diagram the general trend of all the quantitative parameters
with respect to PSA levels are very obvious in alive patients, which is
opposite to that of the patients who were dead. It was observed that the
baseline bone scans have high values as compared to the follow up scans
(extreme right sided). Moreover the PSA levels taken during the follow up bone
scan also shows marked decrease relative to the PSA levels taken before
baseline bone scans, signifying that decrease in PSA levels in follow up scan
and a similar trend of decrease values of all the four quantitative parameters
results in good and disease free survival of the patient.
4.8
Quantitative Parameters and Survival Curves
The
survival curves were generated by using the respective cut off values to the
data set of 40 patients for a period of two years.
4.8.1
Survival Curve for %BSI
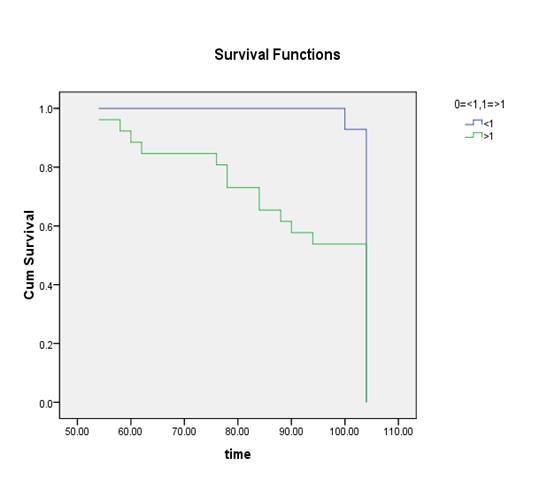
(Time
in Weeks)
Ho:
There is no difference regarding survival among two levels.
H1:
There is difference regarding survival among two levels.
The Chi-squared statistic
of log rank test is 6.232 with associated P-value (0.013) of less than 0.05
rejects null hypothesis. The conclusion therefore is that, statistically, the
two survival curves differ significantly, or that the grouping variable has a
significant influence on survival time. Rejection of null
hypothesis shows that two levels <1 and > 1 are not identical regarding
survival. The conclusion is that the curve representing the patients with
the decrease tumour burden (<1) has low risk and good survival then with the
curve representing the patients (>1) with more tumour burden.
4.8.2
Survival Curve for %PAB
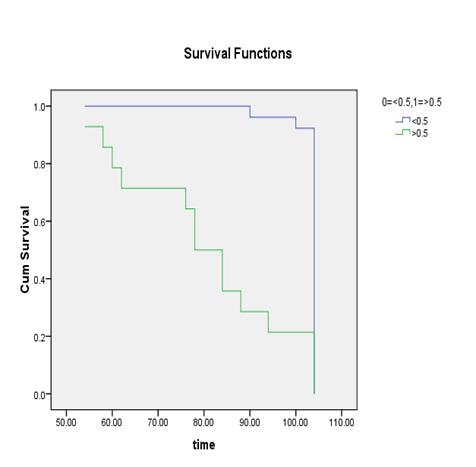
(Time
in Weeks)
Ho:
There is no difference regarding survival among two levels.
H1:
There is difference regarding survival among two levels.
The Chi-squared statistic
of log rank test is 28.257 with associated P-value 0.000 less than 0.05 rejects
null hypothesis. The conclusion therefore is that, statistically, the two
survival curves differ significantly, or that the grouping variable has a
significant influence on survival time. Rejection of null
hypothesis shows that two levels <0.5 and > 0.5 are not identical
regarding survival. The conclusion is that the curve representing the
patients with the decrease tumour burden (<0.5) has low risk and better
survival then the patients with %PAB values >0.5.
4.8.3
Survival curve for EOD
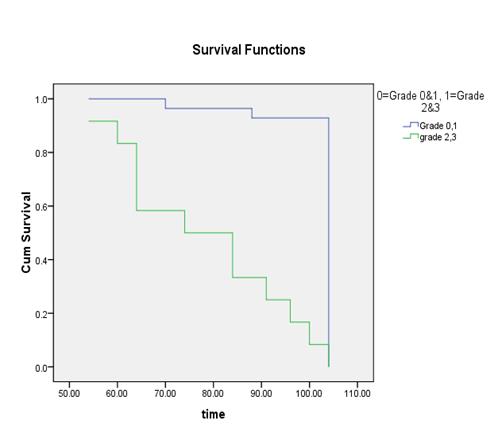
(Time
in Weeks)
Ho:
There is no difference regarding survival among two levels.
H1:
There is difference regarding survival among two levels.
The Chi-squared statistic
of log rank test is 79.615 with associated P-value 0.000 less than 0.05 rejects
null hypothesis. The conclusion therefore is that, statistically, the two
survival curves differ significantly, or that the grouping variable has a
significant influence on survival time. Rejection of null
hypothesis shows that two levels 0=grade 0&1 and 1= grade 2&3 are not
identical regarding survival. The conclusion is that the curve representing
the patients with the decrease tumour burden (grade 0&1) has decrease risk then
with the curve representing the patients (grade 2&3) with more tumour
burden.
4.8.4
Survival curve for BLS
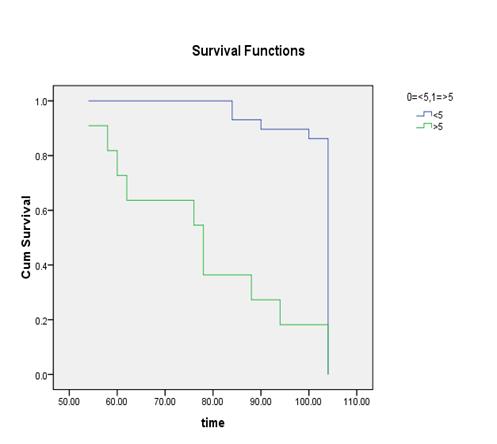
(Time
in Weeks)
Ho:
There is no difference regarding survival among two levels.
H1:
There is difference regarding survival among two levels.
The Chi-squared statistic
of log rank test is 26.88 with associated P-value 0.000 less than 0.05 rejects
null hypothesis. The conclusion therefore is that, statistically, the two
survival curves differ significantly, or that the grouping variable has a
significant influence on survival time. Rejection of null
hypothesis shows that two levels <5 and >5 are not identical regarding
survival. The conclusion is that the curve representing the patients with
the decrease tumour burden (<5) has good survival and decrease risk then
with the curve representing the patients (>5) with more tumour burden.
5 DISCUSSION
The bone metastasis is
one of the commonest complications of few tumours. The tumours that most
commonly metastasize to bone are the tumours from the prostate in men and
breast in women. Among the complication of bone metastasis, bone pain, is the
worst consequence, affecting 66% of the patients who have the bone metastasis [[135]].
The patients with
prostate cancer usually don’t have any clinically measurable or evaluable
method for the quantification of their tumour burden by conventional criterion.
Cutanoeus or subcutaneous nodule or palpable lymphadenopathies are uncommon.
Pulmonary or Visceral metastases are also infrequent. Moreover 80% of the
patients have skeletal metastases which are the only clinically obvious areas
of tumour. These lesions are usually osteoblastic or represent a mixed pattern
on plain radiograph but are best defined on the Bone scans. Metastasis to the
bone is the most serious complication of solid malignant neoplasm, and by far
the most common malignant tumour involving the skeleton [[136]].
The present knowledge of
quantifying the metastatic bone disease is still not sufficient. A lot of work
has been done to quantify the bone metastasis using bone scans. Radionuclide
bone scans are strongly positive in cases of bone involvement of prostate
cancer patients irrespective of whether the lesions are lytic, mixed or pure
blastic. The conventional method of calculating the bone metastasis is by
combining qualitative assessment of all the sequential bone scans and bony
films with tumour markers (Such as PSA and Alkaline Phosphatase levels).
Although serum acid phosphatase may present the progression and regression of
disease, approximately 25% -30% of patients with metastatic disease have a
normal acid phosphatase. Thus it cannot be used to tell about the tumour status
[[137]].
Interpretation of bone
scan is a subjective process, dependent on the experience and knowledge of the
nuclear medicine physician is a question. Reports of bone scans often express
uncertainty e-g ‘may be degenerative’ or ‘possible metastasis, and the tumour
burden can be expressed as ‘extensive metastatic disease’. Reporting like this
has a disadvantage as it can be perceived differently by the nuclear physicians
and the
referring physicians.
Such type of communication usually leads to inappropriate and incorrect
treatment in patients with severe disease and an effective medication may be
stopped as a result of a misconception [[138]].
Therefore, a method is needed to define prognostic strata and to assess
response to treatment in the majority of patients, that is, those with
predominantly bone metastasis [[139]].
To
quantitate all bone metastasis in patients is a time consuming task, since the
patients with metastatic involvement usually have more than one disease site.
Several studies have evaluated different ways to quantify the extent of bone
involvement during therapy. Interpretation of the bone scans is a tedious
procedure for the physicians and often leads to misinterpretation either as overestimation
or underestimation of the metastasis. To minimize the risk of
misinterpretation, one of the careful methods is quantitative analysis of the
bone scans in order to ascertain, whether a metastatic lesion is present or
not. There are several methods to-date which can be used to analyse the extent
of such lesions. For example, quantitation of the bone scan i-e % BSI (Bone
scan index) [[140]],
% PAB (Positive area on bone scans) [[141]],
EOD (extent of disease) [[142]]
and BLS (Bone lesion scoring) [[143]].
Among these, %BSI has most frequently been used and validated in various
studies [140-141]. Novel automated software based on %BSI quantitative
calculations has been developed and is in clinical use in many nuclear medicine
departments. However, automated %BSI calculator (EXINI bone TM &
BONENAVITM) have not been extensively employed in routine nuclear
medicine practice because of its high cost. Another potential risk of
inaccuracy in using these automated quantitation softwares is their limited
training databases as these softwares use either Swedish or Japanese patients
data [[144]
-[145]]. Despite
all these shortcomings there is body of evidence that these quantitative bone
scan parameters not only increase interpretation accuracy but can also serve as
image biomarkers. Most of the published literature focuses on determining
accuracy of either one or two parameters at a time. But to date there is not
study comparing all these parameters. Based on this premise this study was
designed to evaluate the accuracy of different bone scan qualitative methods
namely %BSI, %PAB, EOD and BLS. Study also explored each quantitative parameter
as a prognostic indicator in prostate cancer patients.
In
our study we applied four quantitative parameters on baseline bone scans to
assess the tumour burden of 141 histopathologically proved carcinoma prostate
patients. Results of all fours quantitation methods were individually compared
with PSA levels (ng/ml), to evaluate the efficacy of all these parameters as
effective disease status indicator. For evaluation as a prognostic indicator,
40 patients having a serial follow up scans were chosen. The follow up datasets
were again analysed using the same four bone scan quantitative parameters. For
purpose of quantification arbitrary cut off were applied for each parameter.
Cut offs were % BSI: <1 low risk and >1 high risk , % PAB: <0.5 was
low risk while >0.5 means high risk patients, EOD: grade 0&1 were
considered low risk , grade2, 3&4 were considered as high risk, and in BLS:
score of <5 was considered low risk and >5 was vice versa.
Age
range of our study population was between 60 years -85 years in our study
population with the mean age of 75 years. Most of the published data showed
similar age range of age as seen in our patient cohort [140-141].
1.1
2.1
3.1
4.1
5.1
5.1
Bone Quantitative Parameters as Indicators of Disease
Burden
PSA
level is mostly wide used tumour marker for disease status. Progression or
regression of disease post treatment is evaluated on serial PSA measurements.
Post treatment elevation of PSA invariably predicts tumor progression and can
precede clinical evidence of the event by about 6 months. Parameters like pre
and post treatment PSA, PSA doubling time, PSA nadir values, percentage of PSA
decline are exhaustively investigated as disease status indicators, disease
progression predictor or survival marker [[146]
-[147]]. Taking
PSA as true indictor of disease, we investigated the relation between the PSA
levels and the tumour burden in the baseline bone scan and later investigated
the role of these quantitative parameters in both baseline and follow up scans.
When we compared the correlation of PSA with the bone scan quantitative
parameters, our study results showed that all four quantitative parameters
assess the tumour burden to varying degree of accuracy but all these parameters
have almost linear correlation with PSA levels. Best linear correlation was
seen in % PAB method where R^2 was 0.92 closely followed by % BSI method where
R^2 was 0.89. %PAB method was initially evaluated by Noguchi et al [[148]] and in their study they applied univariate and
multivariate regression analysis and their results showed that only %PAB came
out be the most significant disease predictor for survival among all the
variables they studied. In the study Noguchi et al concluded that %PAB is a
simple and reproducible method for estimating skeletal involvement in prostate
cancer patients. Although in our study we applied ordinary least square
regression analysis using PSA as dependent variable and it showed that our %PAB
data has t-statistics value is within the prescribed range of -1.96 to +1.96.
Our own conclusion was that %PAB method is easier to calculate as compared to
%BSI which needs rigorous calculations. The main advantage of the %PAB method
is its simplicity, accuracy in the measurements of region of interest and
reproducibly which carefully estimates the percentage of the skeleton involving
tumours in prostate cancer. As every single lesion is considered and calculated
by drawing region of interest.
When
comparing our PSA findings with %BSI results it was seen that there is
significant linear correlation present between these two variables with R^2 of
0.89. Similarly OLS regression analysis showed t-statistics finding of %BSI
within the range. There is a large body of evidence about the BSI accuracy,
reproducibility & validity as a bone disease predictor, prognostic &
survival indicator and treatment response evaluator [[149],[150],[151]]. BSI is
most frequently used bone quantitative parameters it was first introduced by Imbriaco
et al [[152]].
Initially the calculation were done manually
but now based of BSI calculation formulas, automated BSI software are available
commercially. One reason for evaluating BSI along with other less commonly used
quantitative parameters was that this automated software although commercially
available but expensive in terms of developing country setting. Moreover these
softwares used Swedish and Japanese datasets for training and comparison which
may lead to erroneous results in our setting.
Our
comparison of PSA with EOD and BLS showed linear correlation but of moderate
degree with R^2 values of 0.61 and 0.51 respectively. EOD was compared with
%PAB by Noguchi et al [[153]]
and it was concluded that %PAB is significantly better bone disease predictor
as compared to other quantitative parameters. EOD was one of these quantitative
parameter. EOD and BLS are relatively simpler quantitation methods without
using mathematical formulas. These parameters use only number of lesion and
their sites; however our results consistently showed that they are less
accurate when compared with the %PAB and % BSI. This was confirmed in the OLS
regression analysis results where t-statistics value of EOD parameters lie
outside the prescribed range showing that these results are not in full
concordance with PSA values. The reason for relatively worse performance of BLS
and EOD may be that there may be difficulty in visually counting individual
lesions when lesions increase in number. Error may also be due to sites of
lesions as lesions in the ribs are difficult to count and quantify, and
assessment of lesions in the pelvis is complicated by the three-dimensional nature
of the pelvic bone.
5.2
Bone Quantitative Parameters as Prognostic Indicators
and Treatment Response Evaluator
In
subset of our patient population we did serial scanning to evaluate the
efficacy of the four bone quantitative parameters as prognostic and survival
indicators and a guide for treatment response evaluation. Utility of bone scan
quantitative parameters as bio-imaging markers is most extensively explored.
However, only BSI has been utilized for this purpose. Especially after the
availability of the commercial BSI software there is growing research and
clinical use of this Bone scan quantitation parameter in prognostic and
survival analysis. Its utility is not only focused in prostate cancer patients
but also there have been research studies utilizing it in all epithelial cell
tumours leading to bone metastasis. In our study population of 40 patients we
did serial scanning and predicted survival based on these parameters.
In
our study, 40 patients underwent serial scanning and quantitation on both the
baseline and follow up bone scans was done and its correlation with the PSA
levels was calculated.PSA levels were taken before baseline and after follow up
bone scans. It was concluded that the quantitative parameters were good in
explaining tumour burden as regression or progression of disease, with decrease
survival in patients having increased tumour burden in follow up scans. The
patients who had tumour burden (More numerical values) of the baseline bone
scan quantitative parameter then the follow up bone scan showed decrease risk
of disease progression and good survival. It was further observed that the after
some specific cut off value of the respective quantitative parameter there is
increasing risk of disease progression. (% BSI: 1, % PAB: 0.5, EOD: grade
0&1, grade2, 3&4 and BLS: 5).
In
EOD parameters grading was done in a way that grade 0 & 1 were taken as low
risk patients and grade 2 and above were taken as high risk patients. In table
4-5 it is shown that those patient whose EOD decreased as compared to the
baseline scan showed better survival as compared to those who had increased in
grade of EOD on subsequent scan (38.4 % vs 61.5 %). In Figure 4-11 it is
noticeable that in alive patients group all the patients were either showing
static disease (same grade) or had decline in grade (N=13). While in dead
patients group 7 patients showed increase in the grade and 5 patients showed
static grades. Out of these 5 patients 3 were already in high risk group but 2
patients were in low risk group ie group 1. This data shows that EOD can
predict outcome and in patients having initial high risk grade or positive
change in grade (from lower to higher) carries poor prognosis. The Chi-squared
statistic of log rank test is 79.615 with associated P-value 0.000 less than
0.05 rejects null hypothesis. The conclusion therefore is that, statistically,
the two survival curves differ significantly, or that the grouping variable has
a significant influence on survival time. Kaplan–Meier plot shows
disease-specific survival after treatment of metastatic prostate cancer for
those with grade 0 & 1 EOD and greater than grade 2(P 0.00).
In %PAB cut off was taken
at 0.5. Below that patient were considered low risk and above that it was high
risk. . In table 4-8 it is shown that those patient whose %PAB values were
decreased in follow up scans as compared to the baseline scan showed better
survival as compared to those who had increased in %PAB on subsequent scan (7.6
% vs 92.3 %). In Figure 4-14 it is noticeable that in alive patients group most
of the patients were showing decline in %PAB (N=21). While in dead patients
group 11 patients showed increase in the %PAB and 1 patients showed static
%PAB. Out of these 11 patients 4 were already in high risk group but 7 patients
were in low risk group i.e. %PAB <0.5. However if we make our cut off point
more lower than many of the dead patient will shift into the high risk group.
PAB was initially used by Noguchi et al and they used cut off point at 0.46
[141]. This data shows that PAB can predict outcome and in patients having
initial high risk grade or positive change in grade (from lower to higher)
carries poor prognosis. The Chi-squared statistic of log rank test is 28.257
with associated P-value 0.000 less than 0.05 rejects null hypothesis. The
conclusion therefore is that, statistically, the two survival curves differ
significantly, or that the grouping variable has a significant influence on
survival time. The conclusion is that the curve representing
the patients with the decrease tumour burden (<0.5) has low risk and better
survival then the patients with %PAB values >0.5. Similar findings were
noted by Noguchi as well in 56 patients which they analyzed. Kaplan–Meier plot
shows disease-specific survival after treatment of metastatic prostate cancer
for those with %PAB <0.5 and greater than 0.5 (P 0.00).
For %BSI 1 was taken as
cut off. Below that patient were considered low risk and above that it was high
risk. In table 4-7 it is shown that those patient whose %BSI decreased as
compared to the baseline scan showed better survival as compared to those who
had increased in % BSI on subsequent scan (0 % vs 100 %). In Figure 4-13 it is
noticeable that in alive patients group most of the patients were showing
decline in %BSI (N=19). While in dead patients group all 13 patients showed
increase in the %BSI . Out of these 13 patients 12 were already in high risk
group but 1 patients were in low risk group i.e. %BSI <1. When we compare
results our findings with already published data [[154],[155],[156], [157],[158]]. Dennis et
al in 88 patients showed that a doubling in BSI resulted in a 1.9-fold increase
in risk of death. Log percent change in PSA at 6 months on treatment was also
associated with survival in this study [[159]].This
data shows that % BSI can predict outcome and in patients having initial high
risk grade or positive change in grade (from lower to higher) carries poor
prognosis. The Chi-squared statistic of log rank test is 6.232 with associated
P-value (0.013) of less than 0.05 rejects null hypothesis. The conclusion
therefore is that, statistically, the two survival curves differ significantly,
or that the grouping variable has a significant influence on survival time. Rejection of null hypothesis shows that two levels <1 and
>1 are not identical regarding survival. The conclusion is that the
curve representing the patients with the decrease tumour burden (<1) has low
risk and good survival then with the curve representing the patients (>1)
with more tumour burden.
For BLS 5 was taken as
cut off. Below that patient were considered low risk and above that it was high
risk. In table 4-6 it is shown that those patient whose BLS decreased as
compared to the baseline scan showed better survival as compared to those who
had increased in BLS on subsequent scan (7.6 % vs 92.3
%).
In
Figure 4-12 it is noticeable that in alive patients group most of the patients
were showing decline in BLS (N=22). While in dead patients group all 12 out of
13 patients showed increase in the BLS. Out of these 13 patients 4 were already
in high risk group but 7 patients were in low risk group i.e. BLS <5. The
Chi-squared statistic of log rank test is 26.88 with associated P-value 0.000
less than 0.05 rejects null hypothesis. The conclusion therefore is that,
statistically, the two survival curves differ significantly, or that the grouping
variable has a significant influence on survival time. Rejection
of null hypothesis shows that two levels <5 and >5 are not identical
regarding survival. The conclusion is that the curve representing the
patients with the decrease tumour burden (<5) has good survival and decrease
risk then with the curve representing the patients (>5) with more tumour
burden.
An
overall trend seen in all serial scanning patients was that, there was decline
in quantitative parameter numerical values or it remained stable in comparison
with the patient which died where quantitative parameter numerical values were
mostly increased. Although all parameters were able to predict survival and
prognosis on change of parameter quantification results however, parameters which
were based on number of lesions and not on involvement of skeletal percentage
were not able to predict survival as accurately as others did. For example in
EOD and in BLS the change of grade from 1 category to another was not that
overt and many a time’s patients were in the same group in which they were at
baseline. Similarly when we see correlation with PSA, %BSI and %PAB performed
better than the EOD and BLS. In regression analysis comparison with overall
results R^2 were showing correlation but in t-statistics EOD was not
correlating well with PSA. In survival analysis all parameters performed well
and at give cut off point it was seen that low and high risk patient have
marked difference in survival at 2 years.
So
all quantitative parameters are strong predictors of tumour burden and are
equally good in risk stratification too. The changes seen on serial bone scans
reflected metastatic activity in the skeleton. Deterioration on the bone scan
indicated disease progression or poor prognosis. Improvement on scan reflects
regression of metastatic disease and usually implied a favourable survival.
Consistent stabilization on the scan correlated with clinical stable disease
and was associated with better survival than for the progressing patients.
[1]. Algra PR BJ,
Tissing H, Falke TH, Arndt JW, Verboom LJ Detection of vertebral metastases:
comparison between MR imaging and bone scintigraphy. Radiographics 1991;
11:219-32.
[2]. AM P. Osteonal
and hemiosteonal remodeling: The spatial and temporal framework for signal
traffic in adult bone. J Cell Biochem 1994; 55:273-6.
[3]. AM P. Targeted
and nontargeted bone remodeling: Relationship to basic multicellular unit
origination and progression. Bone 2002; 30:5-7
[4]. Blair HC AN.
Recent advances in osteoclast biology and pathological bone resorption. Histol
Histopathol 2004; 19:189 –99.
[5]. Boyden LM MJ,
Belsky J, Mitzner L, Farhi A, Mitnick MA, Wu D, Insogna K, Lifton RP High bone
density due to a mutation in LDL receptor-related protein 5. N Engl J Med
2002; 346:1513 –21.
[6]. Apolo A P-TN,
Morriss MJ. Novel tracers and their development for the imaging of metastatic
prostate cancer. J Nucl Med 2008; 49:2031–41.
[7]. Boyle WJ SW,
Lacey DL. Osteoclast differentiation and activation. Nature 2003; 423:337-42.
[8]. Brodsky B PA.
Molecular structure of the collagen triple helix. Adv Protein Chem 2005;
70:301 –39.
[9]. Bonewald L MG.
Role of transforming growth factor beta in bone remodeling. Clin Orthop Rel
Res 2S 1990; 33:35 –40.
[10]. Bryden
AA, Hoyland, J. A., Freemont, A. J., Clarke, N. W. & George, N. J. Parathyroid
hormone related peptide and receptor expression in paired primary prostate
cancer and bone metastases. Br J Cancer; 86 :322–5.
[11]. Bryden
AA, Hoyland, J. A., Freemont, A. J., Clarke, N. W. & George, N. J. Parathyroid
hormone related peptide and receptor expression in paired primary Prostate
cancer and bone metastases. Br J Cancer; 86:322–5.
[12]. Burger
EH K-NJ, Smit TH. Strain-derived canalicular fluid flow regulates osteoclast
activity in a remodeling osteon. A proposal J Biomech. 2003; 36:1452
–9.
[13]. DB B. Targeted
and nontargeted remodeling. Bone 2002; 30:2-4.
[14]. Delaisse JM AT,
Engsig MT, Henriksen K, Troen T, Blavier L. Matrix metalloproteinases (MMP) and
cathepsin K contribute differently to osteoclast activities. Microsc Res
Tech 2003; 61:504-13.
[15]. Doherty MJ AB,
Walsh S, Beresford JN, Grant ME, Canfield AE Vascular pericytes express
osteogenic potential in vitro and in vivo. J Bone Miner Res. 1998; 13:828
–38.
[16].
Gallwitz WEea. Low doses of 6-thioguanine and 6–mercaptoguanosine inhibit
osteolytic bone disease caused by metastatic bone cancer. J Bone Min Res
2000; 15:446-450.
[17]. GD
R. Cell biology of the osteoclast. Exp Hematol 1999; 27:1229 –41
[18].
Eriksen EF AD, Melsen F. Bone Histomorphometry. New York, Raven Press
1994; 32:1-12
[19].
Charhon SAea. Histomorphometric analysis of sclerotic bone metastases from
prostatic carcinoma special reference to osteomalacia. Cancer 1983; 51:918–24.
[20]. Guise Taea.
Evidence for a causal role of parathyroid hormone-related protein in the
pathogenesis of human Prostate and Breast cancer-mediated osteolysis. J Clin
Invest. 1996; 98:1544–9.
[21].
Liotta LAK, E. C. The microenvironment of the tumour–host interface. Nature
2001; 411:375-9.
[22]. Locklin RM OR,
Triffitt. Effects of TGFbeta and bFGF on the differentiation of human bone
marrow stromal fibroblasts. JT Cell Biol Int 1999; 23:185 –94.
[23]. MP W.
Hypophosphatasia and the role of alkaline phosphatase in skeletal
mineralization. Endocr Rev 1994; 15:439 –61.
[24]. Plotkin LI MS,
Bellido T. Transduction of cell survival signals by connexin-43 hemichannels. J
Biol Chem. 2002; 277:8648 –57.
[25]. RS T. Blood and
bone: Two tissues whose fates are intertwined to create the hematopoietic stem
cell niche. Blood 2005 [Pub Med]; 105:2631 –9.
[26]. Rubin CT LL.
Osteoregulatory nature of mechanical stimuli: Function as a determinant for
adaptive bone remodeling. J Orthop Res. 1987; 5:300 –10.
[27]. Shin CS LF,
Sheikh S, Weitzmann L, Cheng SL, Civitelli R Relative abundance of different
cadherins defines differentiation of mesenchymal precursors into osteogenic, myogenic,
or adipogenic pathways. J Cell Biochem 2000; 78:566 –77.
[28]. Smit TH BE,
Huyghe JM Is BMU-coupling a strain-regulated phenomenon? A finite element
analysis. J Bone Miner Res. 2002; 15:301-7.
[29]. Ubara Y TT,
Nakanishi S, Sawa N, Hoshino J, Suwabe T, Kaitori H, Takemoto F, Hara S,
Takaichi K. . Significance of minimodeling in dialysis patients with adynamic
bone disease. Kidney Int 2005; 68:833 –9.
[30]. Xing L BB.
Regulation of apoptosis in osteoclasts and osteoblastic cells. Biochem
Biophys Res Commun. 2005; 328:709 –20.
[31]. Silver IA MR,
Etherington DJ Microelectrode studies on the acid microenvironment beneath
adherent macrophages and osteoclasts. Exp Cell Res 1988; 175:266
–76.
[32]. Ubara Y FT,
Tagami T, Sawa N, Hoshino J, Yokota M, Kaitori H, Takemoto F, Hara S.
Histomorphometric features of bone in patients with primary and secondary
hyperparathyroidism. Kidney Int 2003; 63:1809 –16.
[33]. Ubara Y TT,
Nakanishi S, Sawa N, Hoshino J, Suwabe T, Kaitori H, Takemoto F, Hara S,
Takaichi K. . Significance of minimodeling in dialysis patients with adynamic
bone disease. Kidney Int 2005; 68:833 –9.
[34]. Weiner S SI,
Addadi L. Structural biology: Choosing the crystallization path less traveled.
Science 1997; 309:1027–8.
[35]. WJ L. The
strength of a calcified tissue depends in part on the molecular structure and
organization of its constituent mineral crystals in their organic matrix. Bone
1995; 16:533 –44.
[36]. Zetter BR. The
cellular basis of site-specific tumor metastasis. N Engl J Med. 1990; 322:605–12
[37]. Pocock NA EJ,
Hopper JL, Yeates MG, Sambrook PH, Eberl S: A twin study. Genetic determinants
of bone mass in adults. J Clin Invest. 1987; 80:706 –10.
[38]. Ruckle HC KG,
Oesterling JE Prostate-specific antigen: concepts for staging prostate cancer
and monitoring response to therapy. Mayo Clin Proc 1994; 69(1):69–79.
[39]. Ross FP TS.
αvβ3 and macrophage colony-stimulating factor: Partners in osteoclast
biology. Immunol Rev 2005; 208:88-105.
[40]. Sabbatini P
LS, Kremer A Prognostic significance of extent of disease in bone in patients
with androgen-independent prostate cancer. J Clin Oncol 1999; 17:948–
57.
[41]. SV R.
Regulatory mechanisms operative in osteoclasts. Crit Rev Eukaryot Gene Expr
2004; 14:255 –70.
[42]. Teitelbaum SL
RF. Genetic regulation of osteoclast development and function. Nat Rev Genet
2003; 4:638 –49.
[43]. Pollen JJ WK,
Ashburn WL .The flare phenomenon on radionuclide bone scan in metastatic
prostate cancer. Am J Roentgenol. 1984; 142:773–6.
[44]. Powell GJea.
Localization of parathyroid hormone related protein in Bone seeking cancer
metastases: increased incidence in bone compared with other sites. Cancer
Res. 1991; 51:3059–61.
[45]. S S.
Musculoskeletal system. In: Gray's Anatomy. New York, Elsevier. 2004; 39:83-135
[46]. Schneider A
KL, Mattos AC, Keller ET, Allen MJ, Pienta KJ, McCauley LK Bone turnover
mediates preferential localization of prostate cancer in the skeleton. Endocrinology
2005; 146:1727–36.
[47]. Taoka T MN,
Lee HJ, Yuh WT, Simonson TM, Rezai K, Berbaum KS Factors influencing
visualisation of vertebral metastases on MR imaging versus bone scintigraphy. Am
J Roentgenol. 2001; 176:1525– 30.
[48]. Saeed Solooki
ARV, Vahid Masoomi. Epidemiology of musculoskeletal tumors in Shiraz, south
of Iran. 2011; 32(4):187-91.
[49]. SV R.
Regulatory mechanisms operative in osteoclasts. Crit Rev Eukaryot Gene Expr
2004; 14:255 –70.
[50].
Vaananen HK ZH, Mulari M, Halleen JM The cell biology of osteoclast function. J
Cell Sci. 2000; 113:377 –81.
[51]. Zhang Jea.
Osteoprotegerin inhibits prostate cancer induced osteoclastogenesis and prevents
prostate tumor growth in the bone. J Clin Invest 2001; 107:1235–44.
[52]. Yoshida Kea.
Serum concentration of type I collagen metabolites as a quantitative marker of
bone metastases in patients with prostate carcinoma. Cancer.1998; 80:1760–7
[53]. Pittenger MF
MA, Beck SC, Jaiswal RK, Douglas R, Mosca JD, Moorman MA, Simonetti DW, Craig
S, Marshak DR: Multilineage potential of adult human mesenchymal stem cells. Science.1990;
284:143 –7.
[54]. Percival RCea.
Biochemical and histological evidence that carcinoma of the prostate is
associated with increased bone resorption. Eur J Surg Oncol. 1987; 13:41–9.
[55]. Logan CY NR.
The Wnt signaling pathway in development and disease. Annu Rev Cell Dev Biol
2004; 20:781-810.
[56]. Martin TJ SN.
Osteoclast-derived activity in the coupling of bone formation to resorption. Trends
Mol Med 2005; 11:76-81.
[57]. Miki T, Yano,
S., Hanibuchi, M. & Sone, S. Bone metastasis model with multiorgan
dissemination of human small-cell lung cancer (SBC-5) cells in natural killer
cell-depleted SCID mice. Oncol Res. 2001; 12:209-17.
[58]. Southby Jea.
Immunohistochemical localization of parathyroid hormone-related protein in
breast and prostatre cancer. Cancer Res. 1990; 50:7710–6.
[59]. Pelger RC,
Hamdy, N. A., Zwinderman, A. H., Lycklama a Nijeholt, A. A. & Papapoulos,
S. E. . Effects of the bisphosphonate olpadronate in patients with carcinoma of
the prostate metastatic to the skeleton. Bone. 1998; 22:403–8.
[60]. Liotta LAK,
E. Cancer invasion and metastases. JAMA. 1990; 263:1123–6
[61]. Koizumi Mea.
Dissociation of bone formation markers in bone metastasis of prostate cancer.
Br J Cancer 1997; 75:1601–4.
[62]. LF B.
Establishment and characterization of an osteocyte-like cell line, MLO-Y4. J
Bone Miner Metab 1999; 17:61 –5.
[63]. Kobayashi S
TH, Ito A, Saito N, Nawata M, Horiuchi H, Ohta H, Ito A, Iorio R, Yamamoto N,
Takaoka K Trabecular minimodeling in human iliac bone. Bone 2003; 32:163
–9.
[64]. Jrr CM. The
new bone biology: Pathologic, molecular, clinical correlates. Am J Med Genet
A 2006; 140:2646 –706.
[65]. H S. Prostate
carcinoma: defining therapeutic objectives and improving overall outcomes. Cancer
Suppl 2003; 97:758–71.
[66]. Hauge EM QD,
Eriksen EF, Mosekilde L, Melsen F. Cancellous bone remodeling occurs in
specialized compartments lined by cells expressing osteoblastic markers. J
Bone Miner Res 2001; 16:1575 –82.
[67]. Eisenhauer EA
TP, Bogaerts J, Schwartz LH, Sargent D, Ford R, Dancey J, Arbuck S, Gwyther S,
Mooney M, Rubinstein L, Shankar L, Dodd L, Kaplan R, Lacombe D, Verweij J Eu
J New response evaluation criteria in solid tumours: revised RECIST guideline.
Cancer.2009; 45(2):228–47.
[68]. Garnero Pea.
Markers of bone turnover for the management of patients with bone metastases
from prostate cancer. Br J Cancer; 82:858–64.
[69]. Al. YBe. PDGF
in breast and prostate cancer promotes osteosclerotic bone metastases. J
Bone Min Res. 2000; 20:15.
[70]. Bubendorf L SA,
Wagner U, Sauter G, Moch H, Wili N, Gasser TC, Mihatsch MJ. Metastatic
patterns of prostate cancer: an autopsy study of 1589 patients 2000; 31:
578–83.
[71]. Carlin BI AG.
The natural history, skeletal complications and management of bone metastases
in patients with prostate carcinoma. Cancer 2000; 88:2989–94.
[72].
Charhon SAea. Histomorphometric analysis of sclerotic bone metastases from
prostatic carcinoma special reference to osteomalacia. Cancer 1983; 51:
918–24.
[73]. Cheville JC
TD, Boelter C, Jenkins R, Lohse CM, Pankratz VS, Sebo TJ, Davis B, Blute ML
Metastatic prostate carcinoma to bone. Cancer 2002; 95:1028–36.
[74].
De Larco JEeaA. A potential role for IL-8 in the metastatic phenotype of
prostate carcinoma cells. J Pathol.2003; 158:639–46.
[75]. Fair
et. al.Clinical significance of repeat sextant biopsies in prostate cancer
patients. Oncology 1997; 49(3):113-8.
[76]. Lieu
et al. Clinical application of a 3D ultrasound-guided prostate biopsy system. jurolonc
1997; 29(3):334-42.
[77]. Cooper RC CC,
Gendernalik JD, Lee HL, Bhatia J, Taichmen RS, McCauley LK, Keller ET, Pienta
KJ Stromal factors involved in prostate carcinoma metastasis to bone. Cancer
2003; 97(2): 739–47.
[78]. Coombes RC DP,
Parsons C, McCready VR, Ford HT, Gazet JC, Powles TJ Assessment of response
of bone metastases to systemic treatment in patients with cancer. Cancer
1983; 52:610–4.
[79]. Levenson RM
SB, Bates HR, Newman RD, Eddy JL, Ihde DC Comparative value of bone
scintigraphy and radiography in monitoring tumour response in systemically
treated prostatic carcinoma. Radiology 1983; 146: 513–8.
[80]. Lindsay R CF,
Zhou H, Bostrom M, Shen V, Cruz J, Nieves JW, Dempster DW. A novel tetracycline
labeling schedule for longitudinal evaluation of the short-term effects of
anabolic therapy with a single iliac crest biopsy: Early actions of teriparatide.
J Bone Miner Res.2006; 21:366 –73.
[81]. Jorgensen NR
TS, Henriksen Z, Civitelli R, Sorensen OH, Steinberg TH. Activation of L-type
calcium channels is required for gap junction-mediated intercellular calcium
signaling in osteoblastic cells. J Biol Chem 2003; 278:4082 –6.
[82]. Imbriaco M, Larson SM, Yeung HW,
Mawlawi OR, Erdi Y, Venkatraman ES, Scher HI. A new parameter for measuring
metastatic bone involvement by prostate cancer: the bone scan index. Clin Cancer Res 1998; 4:1765–1772.
[83]. Schneider A, Kalikin LM, Mattos AC,
Keller ET, Allen MJ, Pienta KJ, McCauley LK. Bone turnover mediates
preferential localization of prostate cancer in the skeleton. Endocrinology 2005; 146:
1727–1736.
[84]. Cheville JC, Tindall D, Boelter C,
Jenkins R, Lohse CM, Pankratz VS, Sebo TJ, Davis B, Blute ML. Metastatic
prostate carcinoma to bone. Cancer 2002; 95: 1028–1036
[85].
Cooper RC, Chay CH, Gendernalik JD, Lee HL, Bhatia
J, Taichmen RS, McCauley LK, Keller ET, Pienta KJ. Stromal factors involved in
prostate carcinoma metastasis to bone. Cancer 2003;
97(3): 739–747.
[86]. Clamp A, Danson S, Nguyen H, Cole D,
Clemons M. Assessment of therapeutic response in patients with metastatic bone
disease. Lancet Oncol 2004; 5:
607–616.
[87]. Bubendorf L, Schopfer A, Wagner U,
Sauter G, Moch H, Wili N, Gasser TC, Mihatsch MJ. Metastatic patterns of
prostate cancer: an autopsy study of 1589 patients. Hum
Path 2000; 31: 578–583.
[88]. Scher H. Prostate carcinoma: defining
therapeutic objectives and improving overall outcomes. Cancer
Suppl 2003; 97: 758–771.
[89]. Clamp A, Danson S, Nguyen H, Cole D, Clemons M. Assessment
of therapeutic response in patients with metastatic bone disease. Lancet Oncol 2004; 5:
607–616.
[90]. Eisenhauer EA, Therasses P, Bogaerts
J, Schwartz LH, Sargent D, Ford R, Dancey J, Arbuck S, Gwyther S, Mooney M,
Rubinstein L, Shankar L, Dodd L, Kaplan R, Lacombe D, Verweij J. New response
evaluation criteria in solid tumours: revised RECIST guideline. Eu J Cancer 2009; 45(2):
228–247.
[91]. Ulmert
D KR, Fox JJ, et al. A novel automated platform for quantifying the extent of
skeletal tumor involvement in prostate cancer patients using the Bone Scan
Index. Eur Urol 2012; 33:78-84.
[92]. Zhang QX,
Borg, A., Wolf, D. M., Oesterreich, S. & Fuqua, S. A. An estrogen receptor
mutant with strong hormone independent activity from a metastatic cancer. Cancer
Res 1997; 57:1244–9.
[93]. Sijens PE VdBM,
Oudkerk M Phosphorus-31 chemical shift imaging of metastatic tumours located in
the spine region. Invest Rad 1997; 32: 344–50.
[94]. Pelger RC,
Hamdy, N. A., Zwinderman, A. H., Lycklama a Nijeholt, A. A. & Papapoulos,
S. E. . Effects of the bisphosphonate olpadronate in patients with carcinoma of
the prostate metastatic to the skeleton. Bone. 1998; 22:403–8.
[95]. Montemurro F
RF, Martinicich L, Cirillo S, Gatti M, Aqlieta M, Regge D Dynamic contrast
enhanced magnetic resonance imaging in monitoring bone metastases in cancer
patients receiving bisphosphonates and endocrine therapy. Acta Rad 2004;
45:71–4.
[96]. Taira A HR,
Gambhir SS Detection of bone metastases: assessment of integrated FDG PET/CT
imaging. Quon A Radiology 2007; 243:204–11.
[97]. Koga Hea. Use of
bone turnover marker, pyridinoline cross-linked carboxyterminal telopeptide of
type I collagen (ICTP), in the assessment and monitoring of bone metastasis in
prostate cancer. Prostate 1999; 39:1-7.
[98]. Hara T KN,
Kishi H . PET imaging of prostate cancer using carbon-11-choline. J Nuc Med.1998;
39:990–5.
[99]. Ogata EP,
paraneoplastic syndrome and cancer metastasis. JBMM 2001; 19:
5-7.
[100]. Charles-6.Edwards
EM dN. Diffusion-weighted magnetic resonance imaging and its application to
cancer. Cancer Imaging 2006; 16:135–43.
[101]. Beheshti
M VR, Waldenberger P, Fitz F, Nader M, Loidl W, Broinger G, Stoiber F, Foglman
I, Langsteger W Detection of bone metastases in patients with prostate cancer
by 18F fluorocholine and 18 F fluoride PET-CT: a comparative study. Eur J
Nucl Med Mol Imaging. 2008; 35:1766–74.
[102]. Even-Sapir E
MU, Mishani E, Mishani E, Lievshitz G, Lerman H, Leibovitch I .The detection of
bone metastases in patients with high risk prostate cancer: 99mTc-MDP planar
bone scintigraphy, single and multi field of view SPECT, 18F-fluoride PET and
18F-fluoride PET/ CT. J Nuc Med. 2006; 47:287 –97.
[103]. Lecouvet
FE GD, Stainier A, Jamar J, d’Othee BJ, Therasses P, Vande Berg B, Tombal B .
Magnetic resonance imaging of the axial skeleton for detecting bone metastases
in patients with high-risk prostate cancer: diagnostic and cost-effectiveness and
comparison with current detection strategies. J Clin Onc. 2007; 25:3281–7.
[104]. Kotzerke J PJ,
Neumaier B, Volkmer B, Guhlmann A, Kleinschmidt K, Hautmann R, Reske SN
Experience with carbon-11 choline positron emission tomography in prostate
carcinoma. Eur J Nuc Med 2000; 27(2): 1415–9.
[105]. Hock JM CM,
Canalis E Insulin-like growth factor I (IGF-I) has independent effects on bone
matrix formation and cell replication. Endocrinology 2004; 122:254
–60.
[106]. Henderson Mea.
Parathyroid hormone-related protein production by cancers, improved survival,
and reduced bone metastases. J Natl Cancer Inst. 2001; 93:234–7.
[107]. M.
Andersson1 LJ, D. Minarik1,S. Mattsson1, S. Leide-Svegborn. International
Commission on Radiation Protection: report of the task group on reference man. Press
NYP, editor1992; 23:20-22
[108]. Luboldt W KR,
Blumstein N, Toussaint TL, Kluge A, Seemann MD, Luboldt HJ Prostate carcinoma:
diffusion weighted imaging as potential alternative to conventional MR and
11C-choline PET/CT for detection of bone metastases. Radiology 2008; 249:1017–
25.
[109]. Morris MJ AT,
Larson S, Ditullio M, Chu E, Siedlecki K, Verbel D, Heller G, Kelly K, Slovin
S, Schwartz L, Scher HI. . Fluorodeoxyglucose positron emission tomography as
an outcome measure for castrate metastatic prostate cancer treated with
antimicrotubule chemotherapy. Clin Cancer Res 2005; 11(9):3210–6.
[110]. Erdi YE HJ,
Imbriaco M, Yeung H, Larson SM. Quantitative bone metastases analysis based on
image segmentation. J Nucl Med 1997; 38(9):1401-6.
[111]. Downey Sea.
Expression of the receptor for parathyroid hormone-related protein in normal
and malignant tissue. J Pathol. 1997; 183:212–7.
[112]. Ciray I AG,
Andreasson I, Edekling T, Hansen J, Bergh J, Ahlstrom H. . Evaluation of new sclerotic
bone metastases in breast cancer patients during treatment. Acta Rad.
2000; 41(2):178–82.
[113]. Clamp A DS,
Nguyen H, Cole D, Clemons M Lancet Assessment of therapeutic response in
patients with metastatic bone disease. Oncol 2004; 5: 607–16.
[114]. Fogelman I CG,
Israel O, Van der Wall H . . Positron emission tomography and bone
metastases. Semin Nucl Med 2005; 35:135–42.
[115]. Taoka T MN, Lee
HJ, Yuh WT, Simonson TM, Rezai K, Berbaum KS Factors influencing visualisation
of vertebral metastases on MR imaging versus bone scintigraphy. Am J
Roentgenol.2001; 176:25– 30.
[116]. Ciray I, Astrom G, Andreasson I,
Edekling T, Hansen J, Bergh J, Ahlstrom H. Evaluation of new sclerotic bone
metastases in breast cancer patients during treatment. Acta
Rad 2000; 41(2): 180–182.
[117]. Langsteger W HM,
Fogelman I The role of fluorodeoxyglucose, 18F dihyroxyphenylalanine,
18F-choline and 18F-fluoride in bone imaging with emphasis on prostate. Sem
Nuc Med 2006; 36:73-92.
[118]. Even-Sapir E, Metser U, Mishani E, Mishani
E, Lievshitz G, Lerman H, Leibovitch I. The detection of bone metastases in
patients with high risk prostate cancer: 99mTc-MDP planar bone scintigraphy,
single and multi field of view SPECT, 18F-fluoride PET and 18F-fluoride PET/CT.
J Nuc Med 2006; 47:
287–297.
[119]. Oyama N AH,
Kanamuru H, Saikawa S, Moriyama N, Oyama N, Akino H, Okada K, Yokoyama O 11C
acetate PET imaging of prostate cancer. J Nucl Med 2002; 43:181–6.
[120]. Ulmert
D, Kaboteh R, Fox JJ, et al. A novel automated platform for quantifying the
extent of skeletal tumor involvement in prostate cancer patients using the Bone
Scan Index. Eur Urol 2012 Jan; 12:78-84.
[121]. Dennis ER, Jia X, Mezheritskiy IS, et al. Bone Scan Index:
A quantitative treatment response biomarker for castration-resistant metastatic
prostate cancer. J Clin Oncol 2012; 30(5): 519-524.
[122]. Erdi
YE, Humm JL, Imbriaco M, Yeung H, Larson SM. Quantitative bone metastases
analysis based on image segmentation. J Nucl Med 1997; 38(9):
1401-1406
[123]. Sabbatini
P, Larson SM, Kremer A, et al. Prognostic significance of extent of disease in
bone in patients with androgen-independent prostate cancer. J Clin Oncol 1999;
17: 948-957
[124]. Poulsen M, Rasmussen J, Johansen A, Lund L, Høilund-Carlsen P,
Gerke O, Edenbrandt L. Bone Scan Index: A strong predictor of outcome in
metastatic, hormone native prostate cancer patients. Urology 2013; 82:
1315-1445.
[125]. Armstrong AJ, Kaboteh R, Carducci MA, et al. Tasquinimod and
effects on bone scan index in men with metastatic castration-resistant prostate
cancer: results of retrospective follow up of a randomized phase 2
placebo-controlled trial. J Clin Oncol 2013; 31:453-455.
[126]. Kaboteh
R, Damber JE, Gjertsson P, Höglund P, Lomsky M, Ohlsson M, Edenbrandt L. Bone
Scan Index: A prognostic imaging biomarker for high risk prostate cancer
patients receiving primary hormonal therapy. EJNMMI Research 2013; 3:9.
[127]. Soloway
MS, Hardeman SW, Hickey D, et al. Stratification of patients with metastatic
prostate cancer based on extent of disease on initial bone scan. Cancer
1988; 61:195-202.
[128]. Shreve PD GH,
Gross MD, Wahl RL. Metastatic prostate cancer: initial findings of PET with
2-deoxy-2-[F-18] fluoro-D-glucose. Radiology 1996; 199:751–6.
[129]. Noguchi M KH,
Ishibashi M, Noda S Percentage of the positive area of bone metastasis is an
independent predictor of disease death in advanced prostate cancer. Br J
Cancer 2003; 88:195–201.
[130]. Kevin J.
Donohoe MLB, B. David Collier, Robert F. Carretta, Robert E. Henkin, Robert E.,
O’Mara HDR. Society of Nuclear Medicine Procedure Guidelines for bone
scintigraphy,June 2003; 3:1-5.
[131].
Dobnig H TR. Evidence that intermittent treatment with parathyroid hormone
increases bone formation in adult rats by activation of bone lining cells. Endocrinology
1995; 136:3632 –8.
[132]. Kaddoura S, Heart
failure, myocardium and pericardium. Sam Kaddoura, Echo Made Easy, London. Churchill
Livingstone 2002; 2: 71-75.
[133]. Morris MJ AT,
Larson S, Ditullio M, Chu E, Siedlecki K, Verbel D, Heller G, Kelly K, Slovin
S, Schwartz L, Scher HI. Fluorodeoxyglucose positron emission tomography as an
outcome measure for castrate metastatic prostate cancer treated with
antimicrotubule chemotherapy. Clin Cancer Res 2005; 11(9):3210–6.
[134]. Richmond CR.
International Journal of Radiation Biology ICRP 1985; Vol. 48
(No. 2):285.
[136]. Sodeman TM.
Batsakis JG. Acid phosphatase. In: Tannenbaum M, ed. UrologicPathology: The
Prostate. Philadelphia: Lea and Feibiger 1977; 2:179-139.
[137].
Citrin DL, Cohen AI, Harberg J, Schlise S, Hougen C, Benson R.Systemic
treatment of advanced prostatic cancer: development of a new system for
defining response. J Urol 1981; 125: 224–227.
[138].
Kaboteh R, Gjertsson P, Leek H, Lomsky M, Ohlsson M et. al. Progression of bone
metastasis in prostate cancer patients- automated detection of new lesions and
calculation of bone scan index EJNMI research 2013; 3(1): 1-6.
[139]. Yagoda
A, Watson RC, Natale RRD el a/. A critical analysis of response
criteria in patients with prostatic cancer treated with cisdiamine dichloride
platinum 11. Cancer 1979; 44:1553-1 560.
[140]. Dennis
et al. Bone scan index: A quantitative a treatment response biomarker for
castration resistant prostate cancer patients. J Clin Oncol 2012; 30:519-523.
[141]. Noguchi M KH, Ishibashi M, Noda S.
Percentage of the positive area of bone metastasis is an independent predictor
of disease death in advanced prostate cancer. Br J Cancer 2003; 88:195–201.
[142].
Soloway MS, Hardeman SW, Hickey D, et al. Stratification of patients with
metastatic prostate cancer based on extent of disease on initial bone scan. Cancer
1988; 61:195-202.
[143]. Mariana Raza, Anders Bjartell, et al.
Increase in bone scan index during abiraterone treatment in relation to reduced
survival in mCRPC patients . J Clin Oncol 2014; 4:32.
[144]. Nakajima K, Nakajima Y, Horikoshi H, et
al.Enhanced diagnostic accuracy for quantitative bone scan using an artificial
neural network system: a Japanese multi-center database project. EJNMMI Res.
2013; 3(1):83.
[146]. Charles
R Pound, Michael K Brawer, Alan W Partin. Evaluation and Treatment of Men with
Biochemical Prostate-Specific Antigen Recurrence Following Definitive Therapy
for Clinically Localized Prostate Cancer. Rev Urol. 2001 spring; 3(2):
72–84.
[147]. Yuh-Shyan Tsai, Tzong-Shin Tzai,,
Johnny SN Lin Yat-Ching Tong , Wen-Horng Yang, Chien-Chen Chang, Hong-Lin
Cheng, Yung-Ming Lin. Prognostic Value of Serial Serum Prostate-Specific
Antigen Measurements in Metastatic Prostate Cancer Patients Treated with
Androgen Ablation . JTUA, June 2005; 16:65-72.
[148]. Noguchi M KH,
Ishibashi M, Noda S Percentage of the positive area of bone metastasis is an
independent predictor of disease death in advanced prostate cancer. Br J
Cancer 2003; 88:195–201.
[149]. Mariana Raza, Anders Bjartell, et al.
Increase in bone scan index during abiraterone treatment in relation to reduced
survival in mCRPC patients .J Clin Oncol 2014; 4:32.
[150]. Atsushi Mizokami, Kouji Izumi, Satoru Ueno,
Yoshifumi Kadono, Hiroshi Wakabayashi, Kenichi Nakajima, Mikio Namiki;
Relationship of bone scan index and progression-free survival after docetaxel
treatment for CRPC patients with bone metastases. J Clin Oncol 2014; 4:32.
[152]. Imbriaco M,
Larson SM, Yeung HW, et al: A new parameter for measuring metastatic bone
involvement by prostate cancer: The Bone Scan Index. Clin Cancer Res
1998; 4:1765-1772.
[153]. Noguchi M KH,
Ishibashi M, Noda S Percentage of the positive area of bone metastasis is an
independent predictor of disease death in advanced prostate cancer. Br J
Cancer 2003; 88:195–201.
[154].
Kaboteh R, Gjertsson P, Leek H, Lomsky M, Ohlsson M et. al. Progression of bone
metastasis in prostate cancer patients- automated detection of new lesions and
calculation of bone scan index. EJNMI research 2013; 3(1): 1-6.
[155]. Takahashi et al. Assessment of bone
scans in advanced prostate carcinoma using fully automated and semi-automated
bone scan index methods. Ann Nucl Med 2012; 26:586-593.
[156]. Reza et al. Prognostic value of
Bone Scan Index for survival in patients with prostate cancer. EANM Annual
Congress; 2012.
[157].
Højgaard et al. Prognostic value of metastasis pattern for morbidity in
prostate cancer measured by quantitative bone scintigraphy. ASCO Annual
Meeting; 2010.
[158]. Poulsen et al. Bone Scan Index: A strong
predictor of outcome in metastatic, hormone native prostate cancer patients. SIU
Congress; 2013.
[159]. Dennis
et al. Bone scan index: A quantitative a treatment response biomarker for
castration resistant prostate cancer patients. J Clin Oncol 2012; 30:519-523.
9
APPENDICES
Appendix A
Proforma
Study Case Number
_______
Utility of bone
scan quantitative parameters for the evaluation of carcinoma prostate
Proforma for data collection
Patients
Demographic Detail Patient
ID ________
Name _________________________________________
Age ___________________________________________
Gender M
Contact No ____________________________________
Brief clinical history
____________________________________________________________________________
____________________________________________________________________________
____________________________________________________________________________
____________________________________________________________________________
Disease
Cancer : Prostate Cancer
H/P Report
_________________________________________________________
PSA Levels
_________________________________________________________
Investigations Others (If any)
__________________________________________________________________________
__________________________________________________________________________
__________________________________________________________________________
Treatment Recent/Previous (If any)
__________________________________________________________________________
Quantitation Methods using bone scans
|
Prostate Cancer
|
Bone
Lesion Scoring (BLS)
|
Extent
of Disease by %PAB
|
Grading
of Metastasis by Numeric counting (EOD)
|
%
Bone Scan Index (%BSI)
|
PSA
Levles ng/dl
|
|
Baseline Scan
|
|
|
|
|
|
|
Follow up scan
|
|
|
|
|
|
Appendix B
%
BSI Calculations
Formula
Used:

= ABC (Grams)

Total Weight Male = 5500gms
Ø Bone
Involvement = Total Weight in Grams x % involvement of bone
Total Percentage of Bone
=ABC (Grams)
Ø %
BSI = ABC (Grams) x 100
Total Skeletal Weight in Grams
Total
Weight Male = 5500gms
Appendix C
Extent
of Disease (EOD) Grading
|
Grade
|
Extent
of Disease
|
|
Grade
-0
|
No
Metastasis
|
|
Grade-
1
|
<
6 Bone Mets, Vertebral Body = 2
|
|
Grade-2
|
6-20
Bone Mets
|
|
Grade-3
|
>
20 Bone Mets but < Super Scan
|
|
Grade-4
|
Super
Scan
|
Appendix D
%PAB
(Positive area on bone scan)
Appendix E
Bone
Lesion Scoring
|
Scoring
|
Skull Metastasis
|
Spine Metastasis
|
Pelvis
|
Thorax
|
Extremities
|
|
0
|
No Mets
|
No Mets
|
No Mets
|
No Mets
|
No Mets
|
|
1
|
< or = 2
|
< or = 2
|
< or = 10%
|
< or = 2
|
< or = 2
|
|
2
|
>2
|
3 to 5
|
10-25%
|
3 to 5
|
3 to 5
|
|
3
|
-
|
>5
|
>25%
|
>5
|
>5
|
Download full article here
A
Note on Membership in the BWW Society-Institute for Positive Global Solutions: Standard
Membership requires an academic level of at least Associate Professor (or the
equivalent in non-academic fields); Fellowship Status is reserved for Full
Professors or equivalent.