Formulae
& Indices for Rating Viscosity-Temperature
Dependency
in Liquids
By
and the Central Institute of Chemistry, Universidade Federal
de Santa Maria (UFSM)
Santa
Maria, Rio Grande do Sul, Brazil
Riemschneider's study group has been concerned for some 60 years
(since 1943) with "Relationships between structure and physical properties
of various classes of chemical compounds" (40). Assessing the vT behaviour
of liquids in this context proved problematical from the very start and - after
critical consideration of all known vT rating processes (Tab 1), - led to the
method of determining the point of maximum curvature: PMC
(33), starting from the UMSTÄTTER equation
The editors
I In connection with the author's own investigations into suitability tests for synthetic compounds with lubricating-oil character, the topic of "indices for rating their vT dependence" acquired particular importance. He had already recognized in 1943-51 that the formulas for vT assessment, derived from and related to practice - listed in Tab 1 (col 2, 3, 4 and dealt with in more detail in Sect III) - could not be considered adequate, above all when it was a question of systematic investigations into the influence of chemical structural characteristics on physical properties, eg investigations into "constitution and physical properties of hydrocarbons, ethers and esters" (40). A new approach for vT rating was needed.
The author considered the possibility of assessing the vT behaviour
of liquids and of rating vT curves by "determining parameters for the maximum
curvature of vT curves"[1]
in 1944 and began tackling it mathematically (29-32), then more intensively
together with Dipl Ing O Matter,
The derivation of this new method for analyzing the vT behaviour of liquids , based on maximum curvature that satisfied the UMSTÄTTER equation was published in the journal "Erdöl und Kohle (Oil and Coal)" in 1968 (33) and included a description and detailed discussion of its first use. The equation for maximum curvature published by RIEMSCHNEIDER and HOYER was:
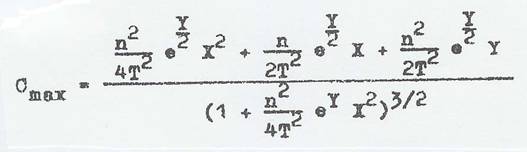
To simplify the calculating, computer programs were written together with M. AZHAR and
tables in (36, 41).
The decision to derive the Cmax formula from the UMSTÄTTER equation (and not from the WALTHER-UBBELOHDE one) was linked to the fact that - contrary to many other vT evaluations - UMSTÄTTER's hyperbolic function is based on solid theoretical considerations, summarized in the APPENDIX.
The author failed to understand why the WALTHER-UBBELOHDE equation was replaced by the UMSTÄTTER one in the German Institute for Standardizations DIN 51 563 of 1968, although - after modifications - the former had already proved itself in the frame of the author's own investigations, not only when applied to hydrocarbons, but also to other families of compounds (ethers, esters).
The many years of thought lying behind the development of this new method of interpretation will be described below, and include critical observations on all the formulas taken into consideration in the literature on vT interpretation, but above all with respect to the altitude of the vT curves in graphs, the shape of the curves and shiftability (rotation[2]) of the curves in graphs: Tab 1 - 3 and Fig 1 and 2.
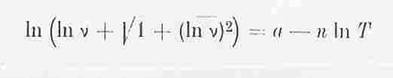
II Among the many formulas describing the vT behaviour of liquids [Tab 1, literature thereon in (1 - 28)] those listed in Eq 1 - 5a, b, c stand out in particular - developed by WALTER-UBBELOHDE (Eq 1), ANDRADE (Eq 2), ANDRADE-VOGEL (Eq 3), UMSTÄTTER (Eq 4) and RIEMSCHNEIDER-GROSS [modified UMSTÄTTER equation: Eq 5a, b, c (37b)]
loglog(vT + 0,8) = b - m logT (Gl.1)
hT = A · eB/T (Gl.2)
v = vo · eB/T-To (Gl.3)
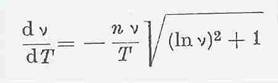
arc sin h (lnvT) = a – n · lnT (Gl.4)
Eq 4 states that straight lines whose gradients are determined by n are obtained if arc sin h (lnv) is plotted as the ordinate against the abscissa (lnT) in a graph (18).
On the modification of the UMSTÄTTER equation (37 a, b, 19): The formula given in Eq 5a was initially developed starting from Eq 4; the form 5b derived from it is suited for calculating, the vT curves being characterized by the constants n and T1 (o K), where v = 1cst is the viscosity. In Eq 5c “n” is linked to the absolute vT dependency and only after conversion does it permit statements about the vT behaviour to be made. The n values are mostly compared directly. T1 can be viewed as a measure for the altitude of the curves in the vT graph.
(Gl.5a)

(Gl.5b)
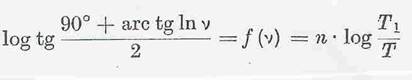
(Gl.5c)
In 1943 – 44 we still used the viscosity pole altitude, the index introduced by WALTHER-UBBELOHDE for assessing the vT behaviour, for evaluating the hydrocarbons synthesized from products of a PECH high-pressure hydrogenation plant (38).
From 1962, we - Prof Dr G R Schultze, Dr H Renner, Dipl Ing O Matter
and the author - devoted a great deal of attention to ANDRADE's formulas as
well as to the results of publications by BRADBUTY, MARK and KLEINSCHMIDT (39,
42a, b) in our discussions about vT relationships. We pigeonholed continuation
of these considerations in favour of UMSTÄTTER's formula and modifications, but
above with respect to a new method of evaluation by means of "maximum
curvature".
At the time, the formula elaborated by UMSTÄTTER's [Eq 4 (18)], and our modifications [Eq 5a-c (37)], represented a considerable improvement over the WALTHER-UBBELOHDE one: it covered the whole range of measurments above 1 cst with adequate exactitude, and thus the measured results too. Our modification simplified using the formula. For a long while, we assessed and discussed the vT behaviour of the organic ether, ester and acetal class compounds we synthesized using this modified UMSTÄTTER equation. It soon became apparent, however, that even the evaluation method based on the UMSTÄTTER equation we had modified was not ideal and in some points deserving of criticism. The n values are, as noted above, not identical with the vT behaviour. They are purely arithmetical constants, so a statement about the vT behaviour can only be made after it is converted by means of Eq 5c. It was in addition considered a disadvantage that different values were obtained for curves of the same shape, depending on their altitude: details in Tab 2 as well as Fig 1 and 2.
Table 2: Compilation of values calculated by maximum curvature method (33)
Kurve n a tmax (°C) vmax (cSt) v’max cSt Cmax
°C
1 3,72 23,245 41,8 21,875 - 0,828 0,0199
1 a 3,72 23,672 77,9 23,60 - 0,826 0,0183
1 b 3,72 22,805 8,6 19,93 - 0,830 0,0218
2 no longer satisfies the UMSTÄTTER- equation
3 3,898 24,460 58,1 21,71 - 0,827 0,0198
4 no longer satisfies the UMSTÄTTER- equation
5 4,123
24,39 - 30,7 16,435 - 0,832 0,0267
Fig 1: vT curves (Tab 2) with same shapes but different altitudes
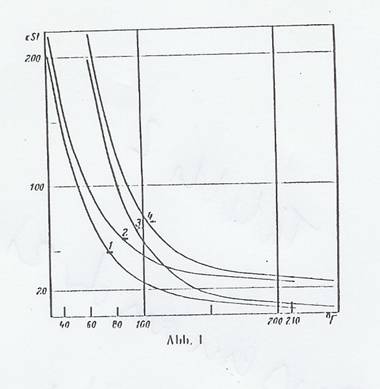
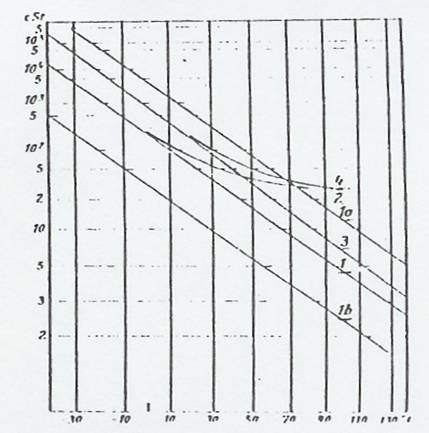
Fig 2: vT curves (Tab 2) in UMSTÄTTER viscogram
The curves in Tab 2 and Fig 1 were selected according to the following criteria: the basic curve listed as 1 in Tab 2 is that of 1,7-dicyclopentyl-4-(3-cyclopentyl-propyl-heptane) whose vT value pairs are taken from a paper by SCHIESSLER and co-workers (28), listed in Tab 3.
Curves 2, 3 and 4 are obtained by horizontal, vertical or diagonal shift, as shown in Fig 1 shows, and are shifted by:
for 2 (v1 = 20cSt, t1),
for 3 (v1, t1 + 30°F) and
for 4 (v1 + 20cSt, t1 + 30°F).
Curves 1a and 1b (Tab 2) have the same UMSTÄTTER steepness n as curve 1, but a different altitude and shape.
Curves 1, 1a, 1b, 2, 3, and 4 are represented once again in the UMSTÄTTER viscogram (Fig 2), where an interesting fact can be observed, namely that only horizontal parallel shift is possible, as curves 2 and 4 no longer satisfy the UMSTÄTTER equation which is, however, universally valid for hydrocarbons.
Surprisingly, one can see in Tab 2 that the gradients of all curves investigated have approximately the same value, as we later confirmed by investigation too. The changes are slight and within the limit of error of the evaluation method, so that the gradient at this point can be considered constant.
This is proof that none of the curves in the vT graph has been rotated.
Table 3: vT values of 1,7-dicyclopentyl-4-(3-cyclopentyl-propyl-heptane (28)
t [° F] t [°C] v [cSt]___
32 0 196,2
68 20 58,02
100 37,8 25,68
140 60,0 11,77
210 98,9 4,64__
This compound is used because in the range of temperatures from 0 - 100oC it covers the greatest possible viscosity range, that includes both lubricating oils and low-viscous substances.
To avoid the problems demonstrated in Tab 2, the author - as noted above - gave some thought to the maximum curvature of vT curves from the 40s on (29 - 32), completed with G A HOYER in the 60s (33): better statements are possible with the aid of maximum curvature using the coefficients Tmax, Vmax and Cmax than with n, a and Tv=1, the latter derived the UMSTÄTTER equation as modified by RIEMSCHNEIDER-GROSS (37b, 19).
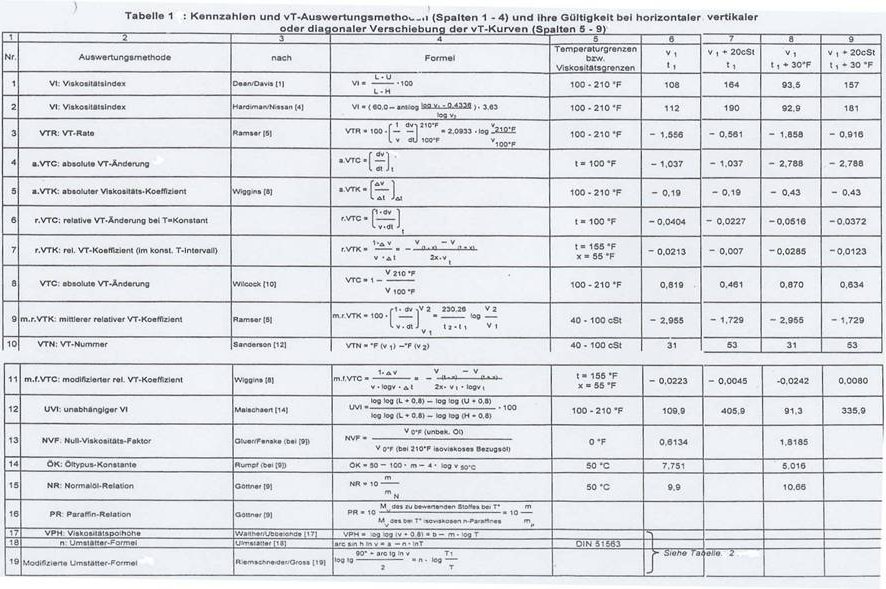
III Discussion of data in Tab 1, in particular with respect to shape and altitude of the vT curves (Tab 1, col 5 - 9)
When the author began to concern himself with the vT behaviour of lubricating oils and lubricating-oil-like hydrocarbons (1943/44), there were many ways of designating the curve shape and thus the vT dependence in the literature, eg ref (1 - 4, 6, 8, 10, 13 - 16), which were then subject to important complements till 1951 (5, 7, 9, 11, 12).
In this context, the shapes and altitudes of the vT curves plotted according to the formulas given are taken into consideration in Tab 1 col 5 - 9; the problem of the shiftability of the curves was primarily tested, and it turned out that all of the evaluation methods mentioned in the table and the accompanying text are in this respect inadequate, in contradistinction to the newly developed Cmax method (33, 36).
Discussions of the coefficients and vT evaluation methods familiar from the literature follow with the help of Tab 1.
A common coefficient for the vT dependence in the oil industry is the viscosity index (VI) of DEAN and DAVIS (1): Tab 1, ser no 1, which is identical with the kinematic viscosity index proposed by Hersh et al (2); the latter uses v values in cst instead of SAYBOLT seconds for calculating, but even after it was modified (3) this VI remains merely a relative measure that refers to a series of empirical comparisons. But this does not meet the demands we put on an ideal method of interpretation. Its greatest disadvantage is that it gives different values for curves of the same shape that are only vertically, diagonally or horizontally shifted in the vT graph, as can be seen from the viscosity index in Tab 1, ser no 1, col 5-9 (example of use according to Tab 1 and Fig 1). It is thus useless for studying the influence of structure on vT behaviour.
The viscosity index of E
For both the VI of DEAN and DAVIES (1) as well as that of HARDMAN and NISSAN (4) this disadvantage is in part the result of choosing constant temperature limits, so that corresponding temperature intervals are not compared with one another, and in part due to the definitions, which result in the VI being viscosity-dependent.
The viscosity index zones introduced by LARSON and SCHWADERER (13) are a variation of the VI where the division between the reference series is not linear but angular. Whilst this changes the evaluation scale somewhat, the deficiencies pointed out for the VI remain. And so the same applies as for the viscosity index VI.
MALSCHAERT (14) proposed a variation of the VI that became known in the literature as the independent viscosity index: IVI [Tab 1, ser no 12]. He only replaces the viscosity values of the VI by the corresponding loglog (vk = 0.8) values. Whilst this changes the absolute values, the basis of the method is the same as in the VI as the reference series is retained. And so the same deficiencies are apparent here as in the VI. It follows from Tab 1, ser no 12, col 5-9 that differing values are obtained for curves with the same shape but different altitudes. For this reason, the IVI cannot be recommended for use when interpreting.
A further vT measure, propsed by RAMSER (5), was the vT rate: VTR [Tab 1, ser no 3]. It is quick and easy to calculate, also independent of an empirical formula, but it is equally viscosity-dependent and it only compares a constant temperature interval between 100 and 210oF, which is why it gives different values for curves with the same shape but differing altitudes in the vT graph, as can be seen in Tab 1, ser no 3, col 3 - 9: not suited.
The Swedish Standard's viscosity quota VQ (6) and the index (Kennziffer KZ) of SCHWAIGER (7) are similar to the VTR.
![]()

VQ
= KZ
=
Both also use the ratio of the viscosities at two standard temperatures. Only here the ratio is taken directly, while in the VTR the logarithmic ratio is multiplied by a constant. But this does mean that the manner of interpretation is the same for all three vT measures, and so what was said of the VTR holds true here as well.
The median, relative vT coefficient of RAMSER (5): m r VTC [Tab 1, ser no 9] and the vT numbers of SANDERSON (12): VTN [Tab 1, ser no 10] are measures for vT behaviour within constant viscosity limits.
Both can be calculated quickly and easily, do not presuppose the use of empirical formulas and provide the same values for horizontally shifted curves of the same shape. But the values for curves of different altitudes differ - this being a result of arbitrarily chosen constant viscosity limits, as indicated in Tab 1, ser no 9, 10 - so it is better to forgo using it.
WIGGINS (8) introduced the modified, relative vT coefficient: mf VTC (Tab 1, ser no 11). It too can be calculated independently of an empirical formula and is relatively easy to carry out. Its values, however, relate to a constant temperature interval and are viscosity-dependent. So its values for curves of the same shape but different altitudes differ - as Tab 1, ser no 11 indicates - and it is of no use.
Determination of the absolute vT change: a VTC [Tab 1, ser no 4] is the most elementary vT measure. It can be done at a specific point and is then identical with the ascent of the curve at this point:
a.VTC
=

But then an empirical formula for the vT behaviour is required to calculate it, such as that of WALTHER-UBBELOHDE (17)
[loglog (v + 0.8) = b - m x logT] : Tab 1, ser no 17
or of UMSTÄTTER (18)
[arc sin h Inv = a - n x InT] : Tab 1, ser no 18 - 19
But use of these formulae is restricted to the range it applies to. It is of advantage that the absolute vT change is viscosity-independent. But as a comparison of the vT behaviour of the substances usually occurs at constant temperature, only the verically shifted curves have the same indices for the absolute vT change. The values differ in all other cases, as shown in Tab 1, ser no 4, col 5-9. But if the comparison took place at corresponding temperatures, correct values would be obtained in these cases too. Nevertheless, this method of interpretation has the great disadvantage of providing the same values for all curves of differing shapes at the only corresponding point of the curve it is possible to determine, namely the point of maximum curvature (cf Tab 2 and 3), whilst the values at other corresponding points are quite different. And thus it is inferior to our new evaluation method, where this disadvantage does not pertain. Determination of the absolute vT change can continue to take place in a constant temperature interval. It then corresponds to the vT coefficient of WIGGINS (8).
a.VTK
=
It is true that it is independent of an empirical formula, but it has the same deficiencies as the absolute vT change at constant temperature, as shown in Tab 1, ser no 5.
Further vT measures can be relative vT change at constant temperature: r VTC [Tab 1, ser no 6] or at a constant temperature interval: r VTK [Tab 1, ser no 7]. The former vT index is identical with GÖTTNER's absolute index [Tab 1, ser no 9], which after the application of WALTHER-UBBELOHDE's equation became known as the temperature modulus of kinematic viscosity (Mv). This latter vT measure corresponds to the relative vT coefficient of WIGGINS (8) and is similar to the Gost norm (GN), which only differs by a constant factor (1 : 2x), ref.(15).
GN
=
Once again, the first measure is dependent on an empirical formula of the vT behaviour, whilst the second measure is independent of this. Both measures are, however, viscosity-dependent and relate to constant temperatures or intervals. This is why completely different values are obtained for curves with the same shape but differing altitudes, which makes this method unusable for investigating the influence of structure on vT behaviour, as can be seen in Tab 1, ser no 6 and 7, col 5 - 9.
Another relative vT index is the viscosity/density constant (Viskositäts-Dichte-Konstante) VDK that was developed by HILL and COATS
VDK =
10
∙ d15,6 – 1,0752 ∙ log (S37,8 – 38) ,
10 – log (S37,8 – 38)
S is viscosity in SAYBOLT seconds. It is not possible to use them because their values depend on two physical constants, namely density and viscosity, causing complications and making an independent interpretation impossible, above all when dealing with structural problems.
WILCOCK (10) proposed the vT coefficient: VTC [Tab 1, ser no 8], which corresponds to ROCHOW's (11) absolute vT index,

WILCOCK's VT-coefficient (10)
VTC = 1-
“VTC“ =
ROCHOW's
absolute vT index (11)

but uses different temperature limits. The same applies for it as was put forward for RAMSER's vT rate (5). Its advantages are that is easy to calculate and that it is independent of empirical formulas. Its viscosity-dependence and the choice of constant temperature limits are disadvantageous. This is the reason why the values for curves with the same profile but different altitudes differ, once again, as can be seen in Tab 1, ser no 8, col 5 - 9. So forgo using it.
The paraffin relation: PR [Tab 1, ser no 16] as well as the normal oil relation: NR [Tab 1, ser no 15] are relative vT indices, proposed by GÖTTNER (9). They are based on an empirical reference series, namely the n-paraffins and a normal oil series, and require the use of a formula on the vT dependency. They are easy to calculate using the WALTHER-UBBELOHDE equation and the formula for normal oil
[mN = 4,3 – 0,43 ∙ log v50].
They do, however, provide differing values for curves with the same profile but different altitudes, as the example of the normal oil relation shows: Tab 1, ser no 15/16, col 5 - 6. So these vT indices should not be used.
Two relative indices deserve mention here. The first is the zero viscosity factor (Null-Viskositäts-Faktor): NVF [Tab 1, ser no 13], put forward by Mc'GLUER and FENSKE (13) and the second is oil type constant (Öltypus-Konstante): ÖK [Tab 1, ser no 14], developed by RUMPF (14). Both indices are based on empirical reference series and use the WALTHER-UBBELOHDE equation as a calculating aid, which is disadvantageous and restricts the range the method can be applied to. In addition, both indices provide differing values for curves with the same profile but different altitudes, as can be seen in Tab 1, ser no 13, 14, col 5-8 and again must be reduced to a choice of constant temperature limits, making them unsuitable for evaluating.
One of the most important measures for vT behaviour in use in
It is easy to determine. Determination can be by graph from the viscogram according to UMSTÄTTER (18) or by calculating from two vT values, more simply by using the modified UMSTÄTTER equation of RIEMSCHNEIDER and GROSS: Tab 1, ser no 19. These n-values have the same value for the whole curve, ie they are independent of the vT value pairs used for the calculation. But they are based on the use of an empirical formula, which restricts their use to the range the formula covers, in this case down to about 1 cSt. The UMSTÄTTER steepnesses for curves 1 and 3, which satisfy the UMSTÄTTER equation, were plotted in Tab 4a. It is apparent that the n-values differ for the two curves, that have the same profile but different altitudes. So this evaluation method does not give correct, accurate results. In addition, curves (1a and 1b) with the same steepness as 1 but different altitudes are plotted in Tab 4a, as Fig 2 shows. All three curves (1, 1a and 1b) have different profiles according to the evaluation method to be discussed below.
Table 4a: Values calculted with UMSTÄTTER equation, Tab 1 ser no 19
Kurve n
a tmax
(°C) vmax (cSt) v’max![]() Cmax__
Cmax__
1 3,72 23,245 41,8 21,675 -0,8282 0,0199
3 3,898 24,460 58,1 21,71 -0,8272 0,0198
1a 3,72 23,672 77,9 23,60 -0,8263 0,0183
1b 3,72 22,805 8,6 19,93 -0,8299 0,0218_
Table 4b: Values calculated with WALTHER-UBBELOHDE equation, Tab 1, ser no 17
Kurve m
b tmax (°F) vmax (cSt) v’max![]() Cmax
Cmax
1 3,7443 10,440 88,0 33,36 -0,8234 0,0124
3 3,9075 10,980 118,7 33,78 -0,8233 0,0123
1a 3,7443 10,6285 151,7 38,34 -0,8183 0,0113
1b 3,7443 10,250 31,0 30,59 -0,8240 0,0136
Corresponding results are obtained when the m-values from the WALTHER-UBBELOHDE equation
[loglog (v + 0,8) = b – m ∙ logT)
proportional to the ASTM gradient (20, 21) are used for the
calculation, which is done by means of the
VTKP = [ 1000 log (373:323) ∙ m ]
which use values that depend on or are proportional to m.
Two other vT indices, namely HUGEL's (25) absolute index and WHALEY and LEACH's (26) index were excluded from the start as evaluation methods as they use empirical equations different to those of UMSTÄTTER and WALTHER-UBBELOHDE. The former vT measure uses ANDRADE's formula [(T - b) (log v - a) = c], whilst the latter is based on DRUCKER-GUZMÁN's formula:
[ log v = A + B :T]
A further vT measure deserving of mention is the viscosity pole height (VPH) (17), introduced by WALTHER and used by the author in 1943/44 (27). This is based on WALTHER's observation that the lubricating oil curves of substances with the same chemical origin intersect at the viscosity pole in his graphs. The viscosity poles of lubricating oil series of differing chemical origin are on the viscosity pole straight lines. WALTHER determined the formula empirically. The ordinate section of the viscosity pole concerned was determined as the VPH. It can be determined easily using the pole straights formula
(log TP = 2,410 – 0,194 WP).
It is, however, linked to WALTHER-UBBELOHDE's empirical formula. Both UMSTÄTTER (18) and UBBELOHDE (17) pointed out disadvantages. Moreover, the method is only good for more viscous lubricating oils, as WALTHER himself acknowledged.
Consider the compilation of VPH values for some relatively slightly viscous n-alkanes at room temperature with a carbon number of 14 to 20: Tab 5. Their VPH is not a constant value but rather increases from teradecan to eicosane, although they are of the same chemical origin. The gravest disadvantage is, however, that for two more viscous lubricating oils (1 and 3), ie within the range of application covered by the method, the VPHs differ for curves with the same profile but different altitudes. The author has not used the VPH for these reasons since 1946.
Table 5: VPH values for some n-alkanes
Kurve n-Alkan VPH
1 1,603
3 2,162
a Tetradecan -0,088
b Pentadecan 0,054
c Hexadecan 0,181
d Heptadecan 0,295
e Octadecan 0,392
f Nonadecan 0,480
g Eikosan 0,566
APPENDIX:
Theoretical considerations that led to the UMSTÄTTER hyperbolic function: arc sin h ln v = a - n lnT (18):
The process of internal friction develops heat that must be
dissipated to establish equilibrium, otherwise it should be possible to note a
continual reduction of viscosity every time the viscous force is observed.
Release and cooling commence at the same point in time. This is the reason why
UMSTÄTTER wrote equation 1 as viscosity equation 2 and linked it with
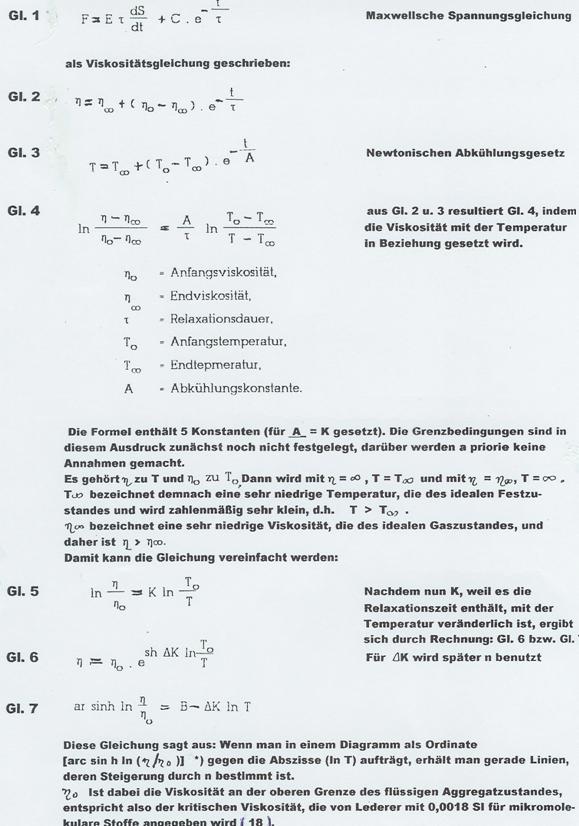
* für Schmieröle, also größermolekulare Kohlenwasserstoffe, die sich nicht annäherend bis zur kritischen Temperatur erwärmen lassen, ergibt sich mit (η0= 0,01 P) ein konstantes n.
BIBLIOGRAPHY:
References (1) to (28) pertain primarily to Table 1 and Section III
( 1 ) E.W. Dean, G.H.B. Davies, Chem.Med.Engng. 36, 618 – 619
(1929); Ind.Engng.Chem. 32, 102 – 107 (1940);
ASTM Designation 553 – 567; DIN 51663
( 2 ) R.E. Hersh, E.K. Fisher, M.R. Fenske, Ind.Engng.Chem. 27,
1441 – 1446 (1936)
( 3 ) DIN 51653, C.M. Larson, W.C. Schwaderer, Oil Gas J. 42,
No. 10, 49 – 53 (1943)
( 4 ) E.W. Hardiman, A.H. Nissan, Journ.Inst. Petroleum 31,
255 – 270 (1945); Verf. privat zugestelltes Vortragsmanuskript
aus dem Jahre 1943
( 5 ) J.B. Ramser, Ind.Engng.Chem. 41, 2053 – 2059 (1949)
( 6 ) Normer for motorsmörjoljor av Svenska teknologförenungens
avdelning för Mekanik, Vov. 1935
( 7 ) ohne Namensnennung, Seifensiedeztg., Parfürmer, chem.
techn. Fabrikant 42, 31 – 32 (1946)
( 8 ) W.R. Wiggins, Journ.Inst.petroleum Techn. 22, 305 – 309 (1936)
( 9 ) G.H. Göttner, Über Kennzahlen für das vT-Verhalten von
Schmierstoffen, Hirzel-Verlag,
75, 502 (1955)
( 10 ) R. Wilcock, Mech.Engng. 66, 739, 46 (1944)
( 11 ) E.G. Rochow, Einführung in die Chemie der Silikone,
Weinheim 1952, S. 95
( 12 ) R.T. Sanderson, Ind.Engng. Chem. 41, 368 – 374 (1949)
( 13 ) C.M. Larson, W.C. Schwaderer, Nat.Petrol. News 24 (2),
26 – 30 (1932) u. 25 (19) 25 – 30 (1933)
( 14 ) F.P. Malschaert, Ann.Soc.
Belge Étude Pétrole 3 (12)
21 – 25 (1939)
( 15 ) Gost-Norm Nr. 3153-51
( 16 ) J.B. Hill, H.B. Coats, Ind.Engng.Chem. 20, 641 – 644 (1928)
( 17 ) C. Walther, Proc.World Petrol.Cragr. 2, 419 – 421 (1933)
L.
Ubbelohde, “Zur Viskosimotrie”,
( 18 ) H. Umstätter,
DIN 51563; Erdöl und Kohle 5, 104 (1952)
( 19 ) R. Riemschneider, P. Groß, Mh.Chem. 91, 48 – 56 (1960);
93, 922 – 932 (1962)
( 20 ) API Standard 533 – 543
( 21 ) ASTM Designation 341 – 343
( 22 ) T.G. Bell, L.H. Sharp, Oil Gas J. 32, No 13 – 14, 13 – 16 (1933)
( 23 ) A.L. Clayden, Nat.Petroleum News 25 (2), 27 (1933)
( 24 ) J.A. Pinkewitsch, Petrol.Ind. 1937, (4/5) 75
( 25 ) M.G. Hugel, Trans. Faraday Soc. 35, 1054 – 1060 (1939)
( 26 ) K.H. Whalley, S.J. Leach, Petroleum [
( 27 ) R. Riemschneider und Mitarbeiter, l.c. (36)
( 28 ) R.W. Schiessler, D.G. Clarke, C.S. Rowland, W.S. Sloatman,
C.H. Herr, Proc. API 24 (III), 49 – 74 (1943)
( 29 ) R Riemschneider (lecturer)
"Methods of evaluating the viscosity-temperature dependence of lubricating oils, thoughts on maximum curvature" („Methoden zur Bewertung der Viskositäts-Temperatur-Abhängigkeit von Schmierölen, Gedanken zur maximalen Kurvenkrümmung“)
Lecture given in chemical colloquium of RUHRÖL GmbH of Bottrop on 06 Jan 44. Ms 15 p - start of drafting Tab 1; cf (30)
(30) R Riemschneider (Lecturer)
"vT evaluation methods" („vT-Bewertungsmethoden“)
Lecture III: "Maximum curvature of vT curves: Cmax"
Ms 1951, given in English in a colloquium at the
MONTECATINI Works, Via Turati,
(31) R Riemschneider (lecturer)
Lecture I: "Critical comments on the practicality of the existing vT evaluation methods, compiled in Table 1"
Lecture II: "Maximum curvature of vT curves: Cmax"
Vmax = viscosity change at the point of maximum curvature.
Lectures given in the framework of a colloquium at the Inst of Oil Research, Hannover Tech Coll, chair: Prof Dr G R Schultze, institute director. Present: only Prof Schultze's close co-workers.
In the following discussion, the newly developed evaluation of viscosity-tem-perature data was viewed as very promising, especially if calculation were simplified.
(32)
R Riemschneider, O Matter, H Renner
Maximum curvature of vT curves (Maximale Kurvenkrümmung von vT-Kurven), Ms Dec 56
based on the five lectures of 06 Jan 44 (29), 06 Jan 48, 15 Apr 51 (30) and 15 May 54 (31)
Cf correspondence with Dr H Renner, Univ of Stuttgart
(later Bayer Werke in
(33)
R Riemschneider, G A Hoyer
Bull XIV: Developing a new evaluation method for the viscosity-temperature behaviour of liquids that satisfies the UMSTÄTTER equation (Entwicklung einer neuen Auswertungsmethode für das Viskositäts-Temperatur-Verhalten von Flüssigkeiten, die der
UMSTÄTTER-Gleichung genügen)
Erdöl, Kohle, Erdgas,
Petrochemie 21 540 - 543 (1968).
Cf series of lectures in Mar 67 (43) dealing in detail with the new vT evaluation method, whose development was completed [PROJECT III 3.1.3 in (36)].
(34)
R Riemschneider, M Azhar
Bull XXIX: Using the computer to evaluate vT indices, description of computer program (FORTRAN) and computation examples, (Anwendung der elektronischen Rechenanlage zur Auswertung von vT-Kennzahlen, Beschreibung des Computer-Programms (FORTRAN) und Rechnungsbeispiel),
Ms 86, 60 p; cf PROJECT III 4.3.1 in (36)
(35) R
Riemschneider,
Bull XL: Description of the computer program developed after FORTRAN in Bull XXXIX: VISUAL BASIC (Beschreibung des im Anschluß an FORTRAN entwickelte Computer-Programms aus Mitt. XXIX: VISUAL BASIC)
Ms July 2000, on CD, copy in PROJECT III 4.3.2 in (36)
(36) R Riemschneider
"Re-reading 66 years of chemistry", („Nachlese – 66 Jahre Chemie“)- in preparation, comprising PROJECTS I to XXVI; here PROJECT III, 10 tables, ser no 12 a - k
(37a) R Riemschneider (lecturer), H Renner
"Constitution and physical properties of hydrocarbons and ethers, beginning to modify the Umstätter equation" („Konstitution und physikalische Eigenschaften von Kohlenwasserstoffen und Ethern, Ansätze zur Modifizierung der Umstätter-Gleichung“),
Ms 1954, given in Skoghallsverken, Skoghall on 15 Apr 54
(37b) R Riemschneider, P Groß
Bull VI: The viscosity-temperature dependence of glycol ethers (Über die Viskositäts-Temperatur-Abhängigkeit von Glykolethern)
Mh Chem 91 48 - 58 (1960)
(38) R Riemschneider
Lubricating oil-like hydrocarbons from products of a PECH high pressure hydrogenation plant (Schmierölartige Kohlenwasserstoffe aus Produkten eines PECH-Hochdruckhydrierwerkes)
Angew Chemie B 19, 92 - 93 (1947), RUHRÖL GmbH, Apr 43 to 20 July 44
(39)
Bradbury, Mark and Kleinschmidt
Trans-Amer Soc Engineering Mechan 73 665 - 670
(40) R Riemschneider loc cit (36), there PROJECT III: Bull I to XXVIII, efs: (267 - 308), (312 - 318)
(41)
R Riemschneider loc cit (36) ref (315)
(42a) R Riemschneider (lecturer), G R Schultze, O Matter, N Brenda
Detailed discussion of "Theories about the viscosity of liquids: modification of the ANDRADE formula for the temperature-dependence of viscosity - connections with the BRADBURY formula for describing highly viscous liquids (264)"
Lecture given in Inst of Oil Research, Hannover Tech Coll, chair: Prof Dr G R Schultze, institute director, in May 57
Ms May 57, 28 p (unpublished)
(42b)
G R Schultze, R Riemschneider
Functional linkage of the quantities: viscosity, density and temperature
2 Mss 57, 20 p (unpublished)
Prof Schultze undertook to adapt and prepare the two
manuscripts (42a) ready for publication
- unfortunately, he died in 1965, so they were not published. The author
dropped the matter due to lack of time. Papers by his former student Dr P Groß,
(43) R Riemschneider
Bull XIX: series of lectures of constitution and physical properties of organic compounds, 5 lecturs at the Chemical Institute of UFSM in 1967: March 8, 9, 11, and 14 and 1973: August 10.
[1] Determining the
point of maximum curvature: PMC
[2] Rotation of curve
about any point on the curve in the graph, a numerical value relating to
corresponding points on the curve; note vertical, diagonal or horizontal
shiftability of curves here.
[ BWW Society Home Page ]
© 2006 The BWW Society/The Institute for the Advancement of Positive Global Solutions