Fundamentals and Practices of Sensing Technologies
by Dr. Keiji Taniguchi,
Hon. Professor of
Xi’ an
Dr. Masahiro Ueda,
Professor of Faculty of Education and Regional Studies
Dr. Ningfeng Zeng, an
Engineer of Sysmex Corporation
(A Global Medical
Instrument Corporation),
Dr. Kazuhiko Ishikawa,
Assistant Professor
Faculty of Education and
Regional Studies,
[Editor’s
Note: This paper is presented as Part IV of a series from the new book
“Fundamentals and Practices of Sensing Technologies”; subsequent chapters will
be featured in upcoming issues of this Journal.]
Chapter 2: Overviews of Classical Transducers
Summary
In this chapter, we provide an overview of several physical transducers and sensors
including analog signal processing circuits. The
descriptions that we provide are as
follows : in section 2.1, thermocouple temperature
transducers; in
section 2.2,
transducers using changes in electrical
resistance; in section 2.3, transducers using
differential
transformers; in section 2.4, capacitive
transducers; in section 2.5, PZT
transducers; in section 2.6, optical sensors using photo devices; in section 2.7,
analog signal processing
circuits; and in section 2.8, application
examples for
measurements.
2.1 Thermocouple Temperature Transducers
2.1.1 Electrical Characteristics of Thermocouples
Thermocouples
are widely used as temperature transducers. As shown in Fig.2.1, an output
signal is generated between the terminals of two dissimilar junction conductors
(wire-pairs) A and B, which were made by contacting and welding the two
conductors together, when the junction point of a
thermocouple has a temperature difference for a reference point. This
phenomenon is well known as the Seebeck- effect. Therefore, this
transducer is a temperature -to-EMF (electro-motive-force) converter which can produce an
output voltage without any additional power sources.

Various dissimilar metal combinations are utilized for this
transducer, and most frequently used combinations and their output
characteristics, i.e., the relationship between the output signals and temperature
based on difference from the ice point are shown in Fig.2.2. In this
figure, symbols Fe, CR, AL, Pt, Rh, W, CN, and Cu express an ion, a chromel,
an alumel, a platinum, a rhogium, a tungsten,
a constantan, and a copper, respectively. The output voltage-rate of an iron-
constantan, and an chromel- alumel themocouples are about ![]() , and
, and![]() , respectively, as shown in this figure.
, respectively, as shown in this figure.
![]()

Fig .2.2 Relationships between Temperature and Output Voltage of
Thermocouples This figure was reprinted from Fig.13.20 in Ref. (1)
2.1.2 Extension of Output Terminals
In
the extension of the output terminals as shown in Fig.2.3, a pair of copper twisted wires is used
for reducing noise induced in the extension wires. In this case, the thermal
EMF at junction points 2 and 3 have canceled each
other (See Fig.2.5). As a result, a thermal EMF at junction point-1 is obtained
from the output terminals of this sensor.

2.1.3 Differential Thermocouples
As
shown in Fig.2.4, the differential connections of thermocouples are used for
measuring the temperature difference between two points, i.e., one is the
measuring point (measurand), and the other is a reference point. In this case, the
output voltage
of the
differential thermocouples is expressed as follows:
![]()
where ![]() is the temperature of
the measuring point,
is the temperature of
the measuring point, ![]() is the temperature of
the reference point,
is the temperature of
the reference point, ![]() is the output voltage of the reference thermocouple, and
is the output voltage of the reference thermocouple, and ![]() is the output voltage of the measuring thermocouple.
is the output voltage of the measuring thermocouple.

.
Fig.2.4 Differential Thermocouples
This method is available for both surface contact and immersion
applications.
【Example
2.1】Find the algebraic
summation of the thermocouple’s EMF in a circuit composed of dissimilar wires
A, B and C as shown in Fig.2.5, where A,B and C express the thermocouple wires
and copper wires, respectively. Numbers 1,2,3,4,5 and
6 also express junction points in this figure, ![]() ,
, ![]() and
and ![]() express the measuring
temperature, the reference temperature and the room temperature, respectively.
and
express the measuring
temperature, the reference temperature and the room temperature, respectively.
and ![]() ,
, ![]() , and
, and ![]() ,(
,(![]() ) express the output voltages of the junction points 1,2
and3,4,5,6, respectively.
) express the output voltages of the junction points 1,2
and3,4,5,6, respectively.

【Solution】
(1)
From Fig.2.5, the output voltage is expressed as follows:
![]()
(2)
The thermal EMF at junction points 3,4,5 and 6 have
the same values. Therefore,
![]()
(3)
From the results mentioned above, we can obtain the following result:
![]()
2.1.4 Analog Signal Processing Circuit for Thermocouple
Transducers
Figure
2.6 shows a balanced amplifier for an analog signal processing circuit using a shielded
twisted cable for the thermocouple transducer. In
this figure, (a) and (b) show a circuit configuration and its equivalent
circuit, respectively, where signals ![]() and
and![]() express the output voltage of a thermocouple and an induced
noise voltage in the shielded twisted pair cable, respectively.
express the output voltage of a thermocouple and an induced
noise voltage in the shielded twisted pair cable, respectively.
The use of a shielded twisted cable can reduce the interference
due to inductive and capacitive noise pickup. The details of this circuit are
described in section 2.7 of this chapter.

2.2 Transducers Using
Change of Electrical Resistance
2.2.1 Introduction
As well known, the resistance ![]() of a conductor is expressed as follows:
of a conductor is expressed as follows:
![]() (2.1)
(2.1)
where ![]() is the uniform cross
sectional area of the conductor,
is the uniform cross
sectional area of the conductor, ![]() is the length of the
conductor, and
is the length of the
conductor, and ![]() is the resistivity of
the conductor.
In transducers using the change of electrical resistance, the length
is the resistivity of
the conductor.
In transducers using the change of electrical resistance, the length![]() and the cross sectional area
and the cross sectional area ![]() are expressed as a function of force or pressure (force/unit area),
and the resistivity
are expressed as a function of force or pressure (force/unit area),
and the resistivity ![]() is also expressed as a function of temperature or force.
is also expressed as a function of temperature or force.
2.2.2 Temperature - Sensing Transducers
A. Solid Metals or Wires Resistive Temperature Transducers
A
resistivity of highly conductive solid metals or wires
increases with a change in temperature. The resistivity of a conductor
at the temperature ![]() is expressed as follows from Matthiessen’s law:
is expressed as follows from Matthiessen’s law:
![]()
![]() (2.2)
(2.2)
where ![]() is the resistivity of
the conductor at the reference temperature
is the resistivity of
the conductor at the reference temperature ![]() ,
,
![]() is the temperature coefficient of
resistivity at
is the temperature coefficient of
resistivity at ![]() ,
,![]() is the temperature difference:
is the temperature difference: ![]() .
.
The resistance![]() of
Eq. (2.1) is, then, rewritten as follows:
of
Eq. (2.1) is, then, rewritten as follows:
![]()
where ![]() .
.
Figure 2.7 shows an analog
signal processing circuit for these transducers. The output voltage of this circuit is
expressed as follows:
![]() (2. 4)
(2. 4)

The
platinum, copper and tungsten wires were usually used as the conductors for
thermocouples. The ranges of
temperature difference are approximately from -180℃ to +630℃.
【Example 2.2】Find
the output voltage![]() in the circuit shown in Fig. 2.7.
in the circuit shown in Fig. 2.7.
(Solution)
Let’s analyze as follows using the Thèvenin theorem:
(1)
We have to cut the two input lines of this amplifier and have to
open these input lines . As a result, the voltages ![]() and
and ![]() shown in Fig.2.7 are expressed as follows:
shown in Fig.2.7 are expressed as follows:
![]() ,
, ![]()
(2)
The resistance between A and B is expressed as![]() , when both points between the
terminal P and the ground of the bridge circuit are connected.
, when both points between the
terminal P and the ground of the bridge circuit are connected.
(3)
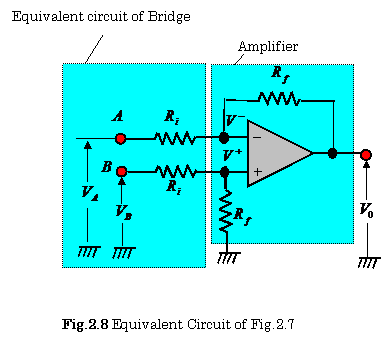
Figure 2.8 shows an equivalent circuit of Fig.2.7,
which can be obtained by means of Thèvenin theorem. The following equations are
obtained from this figure:
![]() ,
, ![]() ,
, ![]()
The
output voltage of this amplifier is, then
expressed as follows
by means of theses equations:
![]()
B. Semiconductor Resistive Temperature Transducer
Thermistors with resistances of NTC (negative temperature
coefficient) are ceramic semiconductors. The NTC thermistors change their
resistance exponentially with a change in temperature. These thermisters can,
then, be used as temperature
transducers.
The resistance ![]() at the
temperature
at the
temperature ![]() of the thermisters is expressed as follows:
of the thermisters is expressed as follows:
![]() (2.5)
(2.5)
where ![]() is the resistance at the temperature
is the resistance at the temperature ![]() ,
,![]() is the thermister coefficient.
is the thermister coefficient.
【Example 2.3】In a
thermistor temperature sensor , find a thermistor constant![]() , when
, when ![]() and
and ![]() are the
resistance values
are the
resistance values
in
temperatures ![]() and
and ![]() ,respectively.
,respectively.
(Solution)
From
Eq. (2.5), ![]() and
and ![]() are expressed as
follows:
are expressed as
follows:
![]() ,
,![]() .
.
From
these equations, the thermistor constant![]() is expressed as follows:
is expressed as follows:
 (2.6)
(2.6)
Thus, the relationship between the resistance and the temperature
is expressed as a non- linear characteristic. From Eq. (2.5), a small change in
the resistance R can be approximated as follows:
![]()
![]() (2.7)
(2.7)
C.
Temperature Transducers Using Semiconductor Devices
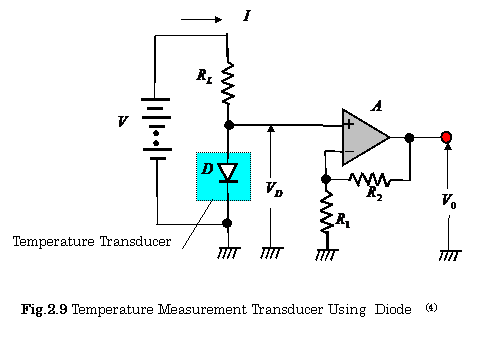
Forward-biased
semiconductor devices can be used for temperature measurements. Figure 2.9 shows a circuit for temperature transducers. A p-n junction diode is used
for these purposes.
The Relationship between the voltage change![]() and the temperature change
and the temperature change![]() is expressed as follows (See comment 2.1):
is expressed as follows (See comment 2.1):
![]() (
(![]() ) (2.8)
) (2.8)
In
this circuit, the current ![]() has to be a
constant-amplitude. This
transducer can measure a temperature within the error of 0.1 ℃ over a range
of approximately
has to be a
constant-amplitude. This
transducer can measure a temperature within the error of 0.1 ℃ over a range
of approximately ![]() .
.
【Comment
2.1】The ![]() -
- ![]() characteristic of a
p-n junction diode is expressed by the following basic equations(10):
characteristic of a
p-n junction diode is expressed by the following basic equations(10):
![]() ,
,![]() ,
, ![]() ,
,
where
![]() is a constant,
is a constant, ![]() is the absolute temperature,
is the absolute temperature, ![]() is the Bolzmann
constant,
is the Bolzmann
constant,![]() is the electron charge, and
is the electron charge, and ![]() is the energy gap.
is the energy gap.
The following equation can be easily obtained from above equations:
![]() (1)
(1)
where
![]() ,
, ![]() ,
,![]() ,
,![]() ,
,
![]() .
.
From Eq.(1) and the
constant values , we can find the following relations:
![]() ,
,![]() ,
, ![]()
![]() ,
, ![]() (2)
(2)
【Example
2.4】In the design
of the sensor shown in Fig2.9 ,
show a necessary condition for which the current ![]() can be operated as a
constant-amplitude.
can be operated as a
constant-amplitude.
(Solution)
From
Fig.2.9, the current is expressed as ![]() . The necessary
condition for which
. The necessary
condition for which ![]() is the constant- current, is as follows:
is the constant- current, is as follows:
![]() (
(![]() ) (2. 9)
) (2. 9)
2.2.3 Strain Gage Transducers Using Solid Metals or
Semiconductors
Strain
gages are electromechanical transducers which convert
a change in strain into a change of electrical resistance.
Strain gage transducers are used for measuring a force, a pressure,
and a flow.
Strain gages are made of solid metals or semiconductors. Figure 2. 10 shows the square bar which
constitutes an electrical conductor. In this figure, one end of this bar is
fixed, and the other end is stretched with the force.
The
average strain is defined as follows:
![]() (2.10)
(2.10)
where ![]() is the original
length,
is the original
length, ![]() is the change in
length.
is the change in
length.
The
sensitivity ![]() of the strain gage is defined as follows:
of the strain gage is defined as follows:
 (2.11)
where![]() is the original resistance .
is the original resistance . ![]() is
the change in resistance.
is
the change in resistance.
The values of ![]() are approximately from
40 to 200.
are approximately from
40 to 200.

【Example 2.5】In the case
that the cross-section of conductor shown in Fig.2.10 has a circular one, the
parameters are given as: ![]() ,
,![]() ,
,![]() ,
,![]() , and
, and ![]() .
.
Find the change of resistance![]() . where
. where
![]() is the diameter of the
conductor .
is the diameter of the
conductor .
(Solution) A cross-sectional area:
![]() .
.
We can, then obtain the following results from Eqs.(2.10) and(2.11).
![]()
![]()
![]()
【Example 2.6】(9)
When a tensile force acts on the conductor shown in Fig. 2.10, the
length and the cross-sectional area of the conductor will be ![]() and
and
![]() , respectively. Show the following relation:
, respectively. Show the following relation:
![]() (2.12)
(2.12)
where![]() and
and ![]() are the Poisson’s ratio and the change of
resistivity, respectively.
are the Poisson’s ratio and the change of
resistivity, respectively.
(Solution)
The change of resistance![]() can be expressed as follows as a linear approximation:
can be expressed as follows as a linear approximation:
![]() (1)
(1)
where
![]() ,
, ![]() ,
, ![]() ,
,![]() ,
,
![]() , Poisson’s ratio:
, Poisson’s ratio:![]()

From the above equations, we can, then, obtain a following
relation:
![]() (2)
(2)
2.3 Transducers Using Differential Transformers
2.3.1 Configuration of Linear Variable Differential
Transformer
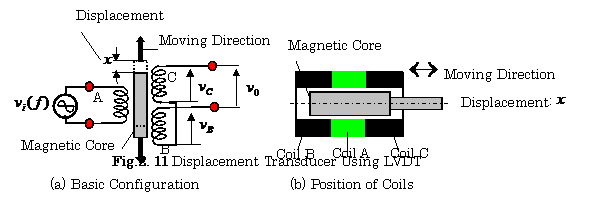
Figure 2.11 shows a displacement transducer
using a linear variable differential transformer (LVDT). This device consists of
a ferrite core, a primary coil A,
secondary coils B and C. The secondary
coils are differentially connected in each other. ![]() is
a voltage source applied to the primary coil, where a frequency
is
a voltage source applied to the primary coil, where a frequency ![]() has to be greater than the upper limit of the transducer
frequency response.
has to be greater than the upper limit of the transducer
frequency response.
2.3.2 Output Voltage Characteristic of LVDT
In
Fig.211, the output voltage of the LVDT is expressed as follows:
![]() (2.13)
(2.13)
where ![]() is the displacement,
is the displacement, ![]() is a constant which depends on the structure of the transducer. Thus
is a constant which depends on the structure of the transducer. Thus ![]() increases linearly for
the increase of
increases linearly for
the increase of ![]()
2.3.3 Circuit for Obtaining DC Output from LVDT
The output voltage ![]() of the LVDT is the AC voltage. A linear rectifier circuit
shown in Fig.2.12, is, then, used to convert
of the LVDT is the AC voltage. A linear rectifier circuit
shown in Fig.2.12, is, then, used to convert![]() into DC voltage
into DC voltage ![]() .
.

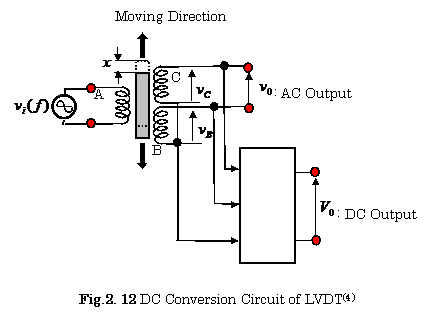
The
linear rectifier circuit consists of small signal linear rectifier circuits and
a subtracting amplifier.
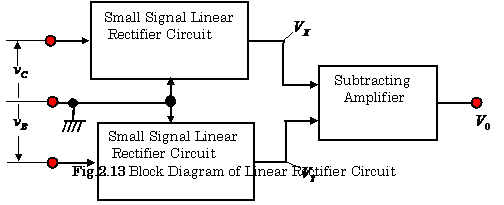
Figure
2.13 shows a block-diagram of a small signal linear
rectifier circuit.
【Example 2.7】Find ![]() which is shown in Fig.2.13 .
which is shown in Fig.2.13 .
In this figure, the small signal linear rectifier circuit and a
subtracting amplifier are shown in Fig. 2.36 and Fig. 2.34, respectively.
【Solution】The
following result is obtained from Eqs.(2.29) and (2.31).
![]() ,
,![]()
![]()
2.3.4 Example of Force
Sensor
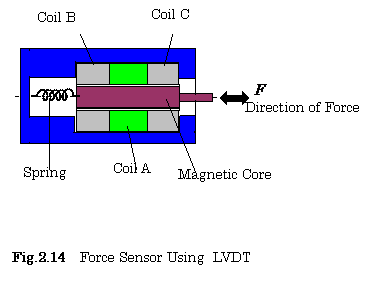
Figure
2.14 shows a force sensor using the LVDT. The force is converted into the displacement![]() using a mechanical spring as follows:
using a mechanical spring as follows:
![]() (2.14)
(2.14)
where ![]() is the force which
acts on the LVDT, and
is the force which
acts on the LVDT, and ![]() is a spring constant.
is a spring constant.
2.4 Capacitive
Transducers
2.4.1 Introduction
As well known, the capacitance
between electrodes, A and B shown in Fig.2.15 is expressed as follows,
![]() (2.15)
(2.15)
where![]() is the area of a electrode,
is the area of a electrode, ![]() ,
, ![]() is the gap distance between electrodes,
is the gap distance between electrodes, ![]() ,
,![]() is a relative permitivity.
is a relative permitivity.

A transducer using electrical capacitance,
can thus be expressed as a function of the area ![]() of an electrode, the gap
distance
of an electrode, the gap
distance ![]() between electrodes, and the relative
permitivity
between electrodes, and the relative
permitivity ![]() of a substance between electrodes A and B (See problem
2.1).
of a substance between electrodes A and B (See problem
2.1).
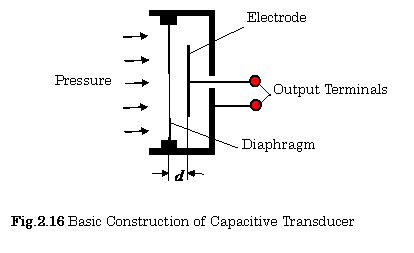
2.4.2 Capacitive Transducer Using
Gap Distance
Figure 2.16 shows a basic construction of a capacitive transducer using the gap distance ![]() . The small change
. The small change ![]() in the capacitance
in the capacitance ![]() due to the small change
due to the small change ![]() in the gap distance
in the gap distance![]() is expressed as follows:
is expressed as follows:
![]()
![]()
A
typical transducer of such a structure is a condenser
microphone.
【Example 2.8】Derive Eq.(2.16)
【Solution】From
Eq.(2.15), the following result is obtained.
![]()
2.4.3 Capacitive
Transducer Using Area of Electrodes (5)
A. Basic Circuit Configuration
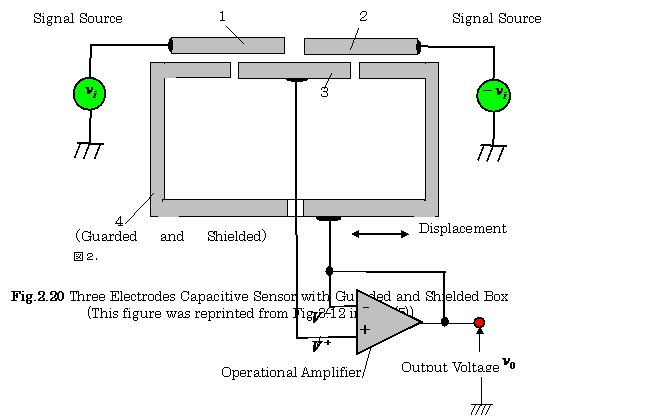
Figure 2.17 shows a capacitance transducer using three electrodes,
where electrode 3 is moved to the right direction with a distance![]() .
.
The capacitance ![]() between electrode 1
and electrode 3 decreases
linearly with
between electrode 1
and electrode 3 decreases
linearly with ![]() , while the
capacitance
, while the
capacitance ![]() increases linearly
with
increases linearly
with ![]() .
.
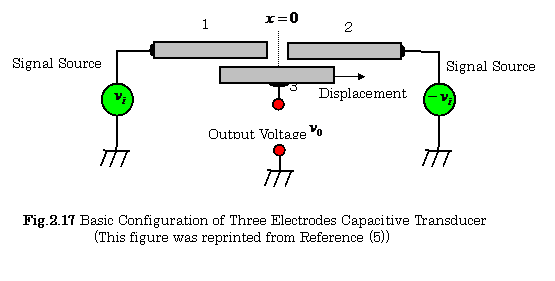
The
voltage ![]() between electrode 3
and the ground is expressed as follows:
between electrode 3
and the ground is expressed as follows:
![]() (2.17)
(2.17)
where ![]() is the voltage between
electrode 1 and the ground, and
is the voltage between
electrode 1 and the ground, and ![]() is the voltage between electrode 2 and the ground.
is the voltage between electrode 2 and the ground.
![]() is the capacitance between
electrodes 1 and 3, and
is the capacitance between
electrodes 1 and 3, and ![]() is the capacitance
between the electrodes 2 and 3.
is the capacitance
between the electrodes 2 and 3.
The value of ![]() in Eq.(2.17) can be approximated as a constant, when the
in Eq.(2.17) can be approximated as a constant, when the
maximum range of
the displacement is between ![]() and
and ![]() as shown in Fig.2.18.
as shown in Fig.2.18.

Figure
2.19 illustrates the fringe effect between electrode 1 and the left edge of
electrode 3. In this situation, the value of ![]() is not constant.
Therefore, the relationship between the output voltage
is not constant.
Therefore, the relationship between the output voltage![]() and the displacement
and the displacement ![]() is non-linear
characteristic.
is non-linear
characteristic.

B.Practical Configuration
For
minimizing the fringe effect, a guarded and shielded
box is used as shown in
Fig.2.20, where an input voltage ![]() of an operational
amplifier nearly equals to the other input voltage
of an operational
amplifier nearly equals to the other input voltage ![]() of that.
of that.
【Example 2.9】Derive Eq.
(2.17).
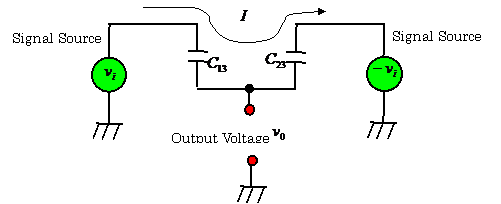
【Solution】The
following equations are obtained by means of an equivalent circuit shown in
Fig. 2.21.
![]() ,
, ![]()
From
these equations, the following result is obtained.
![]()
![]()
C.Example of Capacitive Sensor (6)
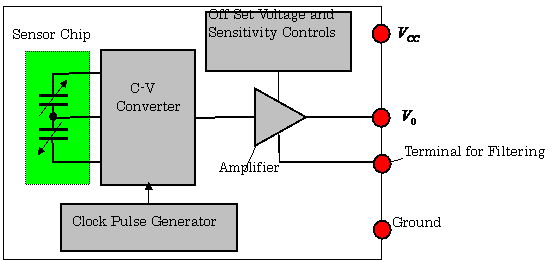
Figure
2.22 shows an example of an acceleration sensor device using a capacitive
sensor chip. The sensor chip in this figure is
made of an ASIC technology.
![]()
2.5 PZT Transducers(1), (2)
2.5.1 Introduction
PZT ceramics are mainly used as
piezoelectric materials. The root of the word “piezo” means pressure, and thus, piezoelectric material implies pressure electric
one.
Chemical
components of PZT ceramics are ![]() , where chemical symbols
Pb,
, where chemical symbols
Pb, ![]() ,
, ![]() and
and ![]() express lead, zirconate, titanate, and oxygen, respectively.
express lead, zirconate, titanate, and oxygen, respectively.
2.5.2 Mechanical and Electrical Characteristics of PZT
PZT that has elastic characteristics, convert
mechanical stress into electrical polarization and vice versa.
Figure 2.23 (a) shows the relationship between the stress (force per unit
area) ![]() which acts on the PZT, the resulting electrical polarization
(electrical charges)
which acts on the PZT, the resulting electrical polarization
(electrical charges) ![]() , caused on the PZT.
, caused on the PZT.
(1) When the mechanical stress ![]() is given to the PZT,
it produces the polarization
is given to the PZT,
it produces the polarization ![]() .
.
The
relationship between the two is expressed as follows: ![]()
where ![]() is the piezoelectric
constant. This phenomenon is called the piezoelectric effect.
is the piezoelectric
constant. This phenomenon is called the piezoelectric effect.
(2) In contrast, when the electric
field ![]() is given to the PZT as
shown in Fig. 2.23(b), it produces the mechanical distortion
is given to the PZT as
shown in Fig. 2.23(b), it produces the mechanical distortion ![]() .
.
The
relationship between the two is expressed as follows: ![]() ,
,
where ![]() is the piezoelectric constant. This phenomenon is
called the reverse piezoelectric effect.
is the piezoelectric constant. This phenomenon is
called the reverse piezoelectric effect.
(3) As described above, the PZT is the elastic material. So,
The relationship between the stress ![]() and the
strain
and the
strain ![]() is expressed as:
is expressed as:
![]() ,
,
where ![]() is the compliance.
is the compliance.
(4) The PZT is the dielectric material. So, The relationship
between the electric displacement ![]() and the electric field
and the electric field ![]() is expressed as:
is expressed as:
![]() ,
,
where ![]() is the dielectric
constant.
is the dielectric
constant.
From
the relations mentioned above, the mechanical distortion ![]() and the electric
displacement
and the electric
displacement ![]() and described by the
linear equations:
and described by the
linear equations:
![]() (2. 18)
(2. 18)
![]() (2.19)
(2.19)
where ![]() , and
, and ![]() are tensors,
are tensors,![]() and
and ![]() are column vectors.
are column vectors.
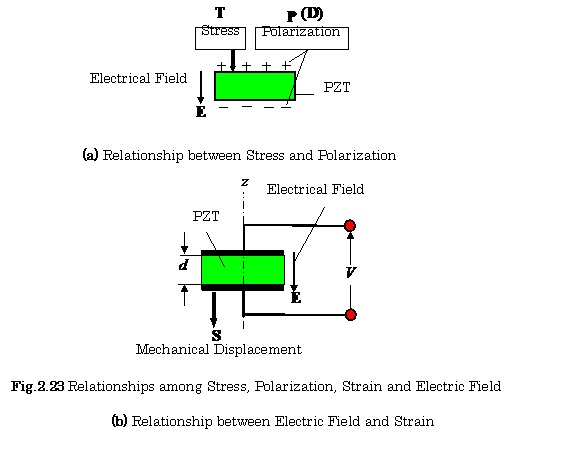
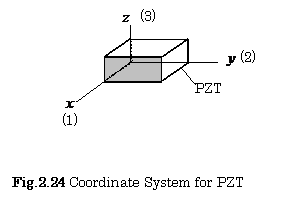
Figure 2.24 shows the
coordinate system for the PZT ceramics, and the numbering expressions. Where, subscriptions
1,2, and 3 express the x, y, and z- axes,
respectively.
Table
5.1 shows these relations.
|
1
6 5
2
4 3
|
Table 5.1 Subscriptions used here
As an example described above, we show the stress-strain
relations as follows:
 (2.20)
【example 2.10】
In Fig.2.23 (b), when the stress is zero(![]() ), determine the following values:
), determine the following values:
(1) strain ![]() ,
,
(2) displacement ![]() .
.
【Solution】From
Eq.(2.18),and Fig.2.23, we obtain the following results.
 ,
,  ,
,  ,
,
(1)![]() , (2)From
, (2)From![]() ,
, ![]() , and
, and ![]() ,
,
![]() is
expressed as:
is
expressed as:![]() .
.
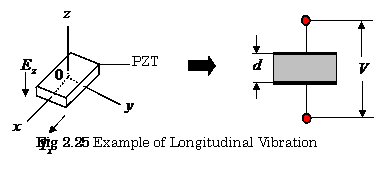
【Example 2.11】From
Eq.(2.20), the
mechanical distortion ![]() and the electric
displacement
and the electric
displacement ![]() for the longitudinal
vibration of the rectangular ceramic element shown in Fig.2.25 are described by
the following equations:
for the longitudinal
vibration of the rectangular ceramic element shown in Fig.2.25 are described by
the following equations:
![]() ,
, ![]()
2.5.3 Pyroelectricity
The electric polarization in the PZT is also caused by thermal
expansion. Such
an effect is called pyroelectricity. The pyroelectric coefficient ![]() is defined as the
partial derivative of the displacement with respect to the temperature
is defined as the
partial derivative of the displacement with respect to the temperature ![]() at constant electric field
at constant electric field ![]() , and it is expressed as follows:
, and it is expressed as follows:
![]() (2.21)
(2.21)
2.5.4 Applications
The
details of these applications are described in almost
all the sections throughout in chapter 3.
[Part II of
Chapter 2 will be presented in the upcoming November-December 2009 issue of
this Journal.]
[ BWW Society Home Page ]
© 2009 The Bibliotheque: World Wide Society