Fundamentals and Practices of Sensing Technologies
by Dr. Keiji Taniguchi,
Hon. Professor of
Xi’ an
Dr. Masahiro Ueda, Professor of Faculty of Education and Regional Studies
Dr. Ningfeng Zeng, an Engineer of Sysmex Corporation
(A Global Medical Instrument
Corporation),
Dr. Kazuhiko Ishikawa, Assistant Professor
Faculty of Education and
Regional Studies,
[Editor’s Note: This paper is presented as Part II of a series of chapters from the new book “Fundamentals and Practices of Sensing Technologies”; subsequent chapters will be featured in upcoming issues of this Journal.]
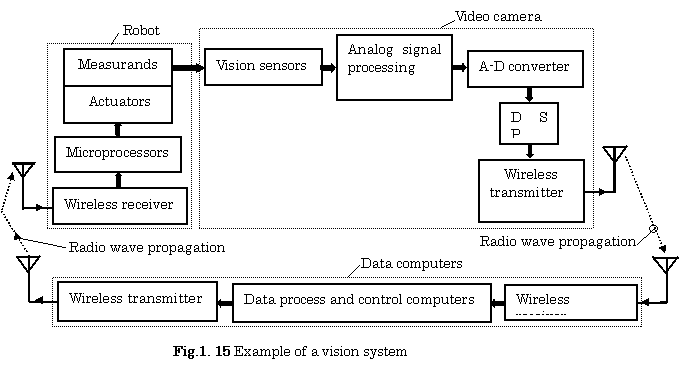
【Example 1.7】An example of a block diagram for a sensing system using vision sensors and actuators is shown in Fig.1.15.
【Example 1.8】A photograph of 60(GHz) Band Communication System which can use for sensing systems is shown in Fig.1.16.
1.1.8 Examples for Sensing Systems
A. Power Train Control for Automotive Engine (13)
From environmental problems, exhaust emissions from automotive engines have to be reduced to lower and lower levels.
For this reason, multiple sensors and actuators are recently used for engine control as shown in Fig.1.17(a).
In this figure, several of sensors are used for measurements such as crankshaft position, intake mass air- flow, manifold pressure, coolant and cylinder head temperatures, and heated exhaust gas oxygen (HEGO, located both before and after the catalytic converter). Furthermore, some of actuators are also used for controls such as throttle valve, exhaust gas recirculation (EGR), ignition plug and fuel injector.
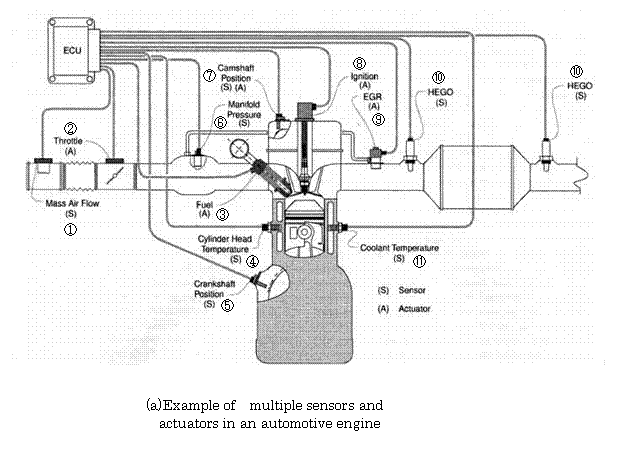
Comments
ECU ( Engine Control Unit):
①:mass air flow sensor ②:throttle valve actuator ③:fuel injection actuator ④:cylinder head temperature sensor ⑤:crankshaft position sensor ⑥:manifold pressure sensor ⑦:camshaft position sensor and actuator ⑧:ignition actuator
⑨:EGR (Exhaust Gas Recirculation)actuator ⑩:HEGO(Heated Exhaust Gas Oxygen)sensors ⑪:coolant temperature sensor
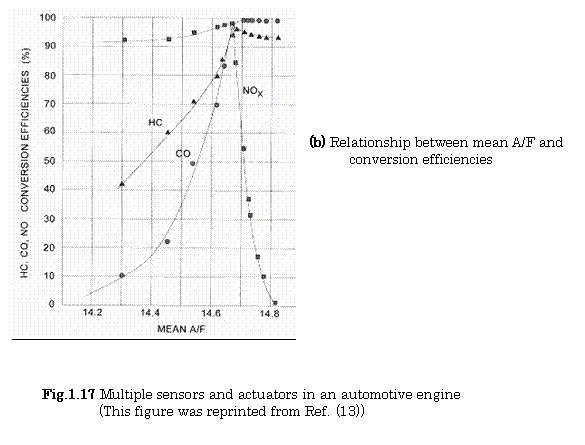
In a gasoline engine, the precise air-fuel ratio (A/F) regulation for emission control is necessary to achieve the high simultaneous conversion efficiencies in the catalytic converter.
Dynamic A/F control, closed-loop regulation of A/F for high catalyst performance, is needed for lower emission control.
Figure
1.17(b) shows the relationships between mean A/F and conversion efficiencies
for the hydrocarbon (HC), the oxide of nitrogen (![]() ) and the carbon mono-oxide(CO).
) and the carbon mono-oxide(CO).
From this figure, it is evident that precise A/F regulation is needed for this purpose.
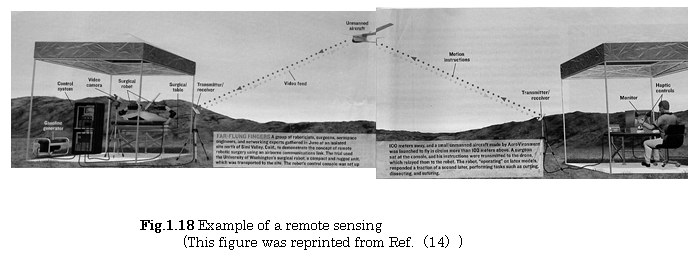
B.Surgical Robot System(14)
A surgical robot system as shown in Fig.1.18 helps to save lives in remote communities, battle fields, disaster-strikes areas, etc..
It consists of a surgical robot, a video camera, communication systems,
an unmanned air vehicle, a surgical console and video monitor, two gasoline generators.
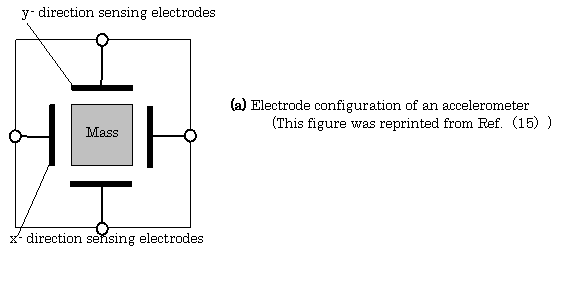
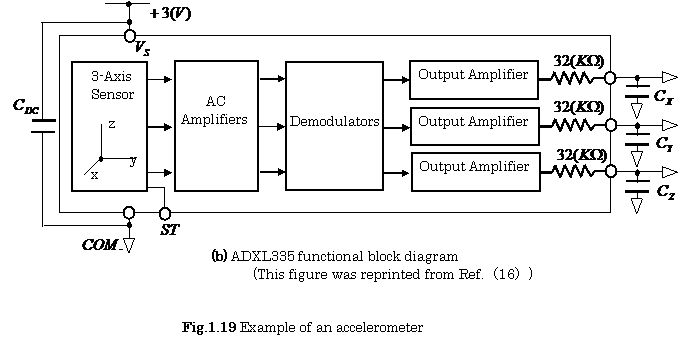
C. Accelerometer as System- on- Chip System
Figure1.19 (a) shows the electrode configuration of an accelerometer which the changes of a different capacitance with two sets of fixed and movable electrodes are sensed independently(15) .
Furthermore, Fig.19 (b) shows the ADXL335 block diagram of the 3-axis accelerometer(16) .
1.2 Transduction Principles for Physical Sensors
1.2.1 Transduction Principles
The most important point in selecting transducers and sensors is based on its transduction principle. Some transduction principles, which are frequently used as transducers or sensors, are shown in the following figures, and their explanations are, also, briefly described as follows:
A. Thermo-EMF Transduction
The measurand:![]() , in the case of the small change
, in the case of the small change ![]() of temperature
of temperature ![]() , is converted into the change
, is converted into the change ![]() of electro- motive- force (EMF)
of electro- motive- force (EMF)![]() , which is called the active transduction element, as shown
in Fig.1.20. Here, wires A and B, are dissimilar
materials.
, which is called the active transduction element, as shown
in Fig.1.20. Here, wires A and B, are dissimilar
materials.
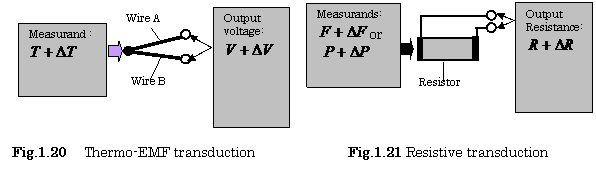
B. ResistiveTransduction
The measurands: ![]() ,or
,or![]() in the case of the small change
in the case of the small change ![]() ,or
,or![]() of the force
of the force ![]() , or pressure
, or pressure ![]() , is converted into the change
, is converted into the change ![]() of the resistance
of the resistance ![]() of a conductor or a
semiconductor as shown in Fig.1.21, which is called the passive transduction
element.
of a conductor or a
semiconductor as shown in Fig.1.21, which is called the passive transduction
element.
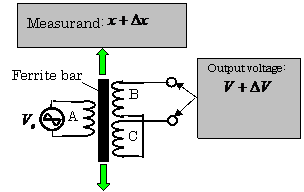
C. Relactive Transduction
The measurand: ![]() , in the case of the small change
, in the case of the small change ![]() of the displacement
of the displacement ![]() , is converted into the change
, is converted into the change ![]() , of the AC voltage
, of the AC voltage![]() , as shown in Fig.1.22, through a small change in the
relactance between both secondary coils B and C, of a transformer due to a displacement,
, as shown in Fig.1.22, through a small change in the
relactance between both secondary coils B and C, of a transformer due to a displacement,![]() , while an AC excitation
voltage
, while an AC excitation
voltage ![]() , is applied to the primary coil A, of the transformer. This is a passive transduction element.
, is applied to the primary coil A, of the transformer. This is a passive transduction element.
Fig.1.22 Relactive transduction
D. Capacitive Transduction
The measurands: ![]() ,
,![]() , or
, or ![]() , in the case of the small change
, in the case of the small change ![]() ,
,![]() or
or ![]() of the distance
of the distance ![]() , area
, area ![]() or electrical permittivity
or electrical permittivity ![]() , is all converted into the change
, is all converted into the change ![]() of the capacitance
of the capacitance![]() , as shown in Fig. 1.23, which is, then, a passive
transduction element. A circuit for converting the small
change of capacitance into the voltage
is, therefore, required as the secondary step.
, as shown in Fig. 1.23, which is, then, a passive
transduction element. A circuit for converting the small
change of capacitance into the voltage
is, therefore, required as the secondary step.
E. Photoconductive Transduction
The measurand: ![]() , in the case of the small change
, in the case of the small change![]() of the light intensity
of the light intensity![]() , is converted into the
change
, is converted into the
change ![]() of the current ( number of carriers ( electron-hole pairs)
generated)
of the current ( number of carriers ( electron-hole pairs)
generated) ![]() , in a photoconductive p-n junction diode reverse-biased as
shown in Fig. 1.24, which is, then, a passive transduction element.
, in a photoconductive p-n junction diode reverse-biased as
shown in Fig. 1.24, which is, then, a passive transduction element.
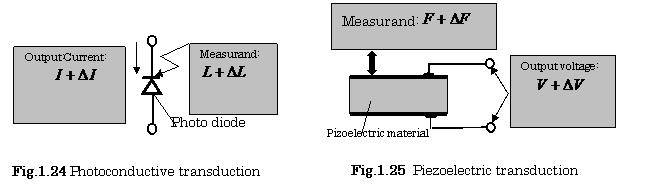
F. Piezoelectric Transduction
The measurand: ![]() , in this case of the small change
, in this case of the small change ![]() of the mechanical stress
of the mechanical stress ![]() , due to tension, or compression forces on a ceramic
crystal, is converted into the change
, due to tension, or compression forces on a ceramic
crystal, is converted into the change ![]() in the voltage (electrostatic charge )
in the voltage (electrostatic charge ) ![]() , as shown in Fig. 1.25, which is, then, an active
transduction element.
, as shown in Fig. 1.25, which is, then, an active
transduction element.
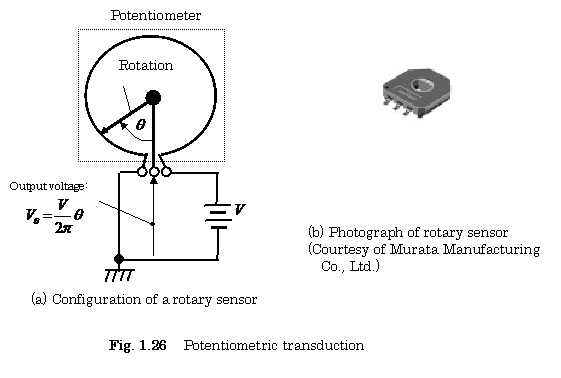
G. Potentiometric Transduction
As shown
in Fig. 1.26(a), the measurand: the rotation angle![]() , is
converted
, is
converted
into the change ![]() in the voltage
in the voltage ![]() .
.
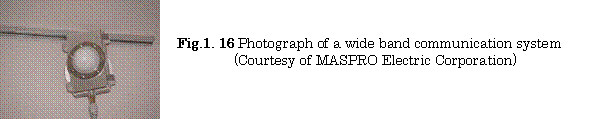
Figure1.26 (b) shows a photograph of a rotary sensor. This sensor is used for animal robot, switch for automotive, motor drive unit, radio control equipment, car audio (navigation system, changer), etc..
These details mentioned above will be described in chapter 2.
1.2.2 Relationship between Measurement Object and Sensing Device
Figure 1.27 shows the relationship between measurement objects and sensing devices.
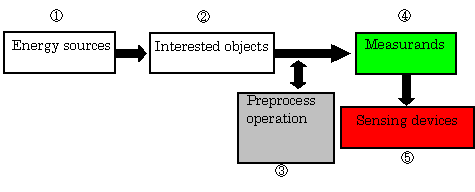
Fig.1.27 Relationship between interested
objects and sensing devices
The elements numbered by①,②,③,④, and⑤ express energy sources, interested objects, preprocess operation, measurands, and sensing devices, respectively. Some preprocesses are required for the effective extraction of the measurands from an interested object. We show here such an example. For example, the important points shown in example1. 1(See Fig. 1. 4), are as follows:
(1) The selection of DC and RF current sources.
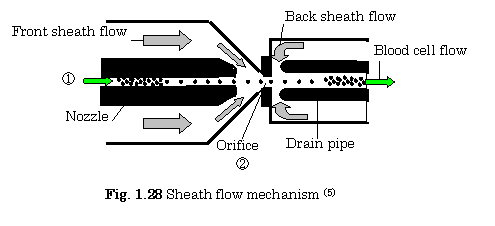
(2) For obtaining higher sensitivity, the optimal design of an orifice in the flow
chamber as shown in Fig. 1.28. This figure shows us that in location①, white
blood cells flow randomly, but in location ②, they flow with continuously some
spaced intervals along the center of stream line.
This method is well known as sheath flowing techniques.
(3) A chemical processing for extracting efficiently measurands from the interested objects. This technique is shown in Fig.1.8.
1.2.3 Configurations of Transducers and Sensors
Figure1.29 shows the relationship between a measurand and an active transducer, where no power supply is required. The thermocouple is a representative example (See Fig.2.3).
Fig. 1.29
Configuration of an active transducer

B. Passive Transducer
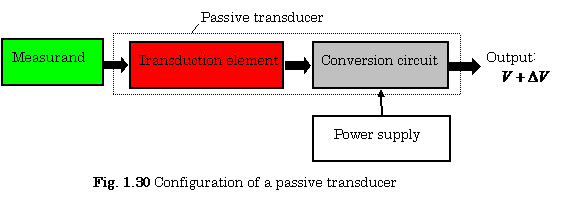
Figure 1.30 shows the relationship between a measurand and a passive transducer, where a power supply is required for the conversion into a voltage. The representative example is a resistive temperature transducer used as a transduction element(See Fig. 2.7).
1.2.4 Active and Passive Sensors
A. Active Sensor
Figure 1.31 shows the relationship between a measurand and an active sensor, where no power supply is required for a transduction element. The representative examples are a diaphragm used as a sensing element and a piezo electric element used as a transduction element (See Fig. 3.16).
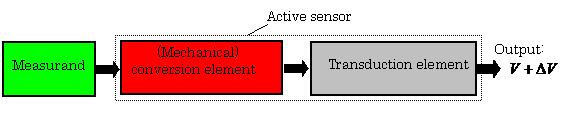
Fig. 1.31 Configuration of an active sensor
|
Fig. 1.31 Configuration of an active sensor |
B. Passive Sensor
Figure 1.32 shows the relationship between a measurand and a passive sensor, where a power supply is required for a conversion. The representative examples are a diaphragm used as a sensing element and a relactive element used as a transduction one (See Fig. 2.14).
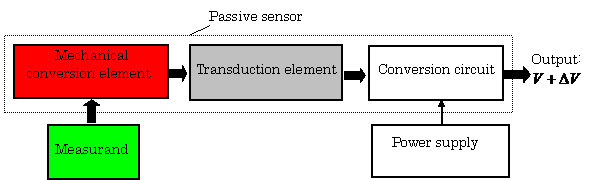
Fig. 1.32 Configuration of a passive sensor
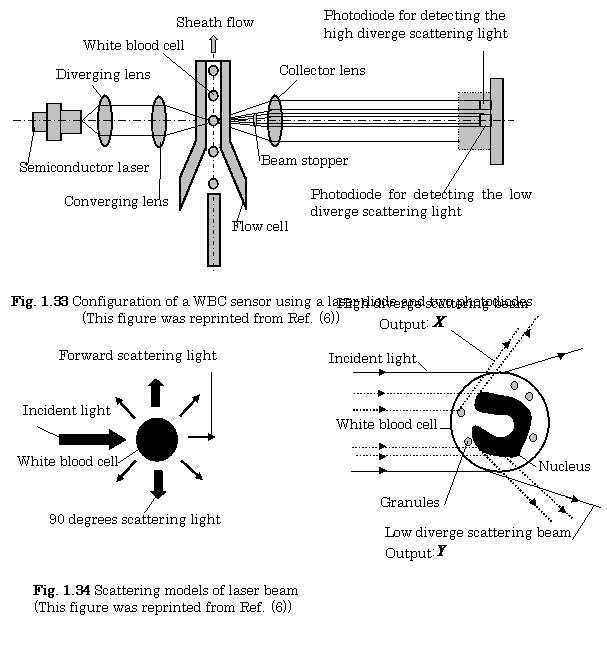
1.2.5 Example of Photo Sensing System (6 ), (17) ,(18)
Figure 1.33 shows the configuration of an automated hematology analyzer using a laser diode as a light generation source and two photodiodes as sensing devices.
In this figure, a mechanism of the generation of sheath flow is shown in Fig. 1.28.
Figure 1.34 shows the scattering models of laser beam caused by a white blood cell. Some definitions used in Fig.1.35 are shown in Fig.1.34.
By using the method shown in Fig.1.7, white blood cells are measured by using the photodiode-sensors set-up in the following different channels.
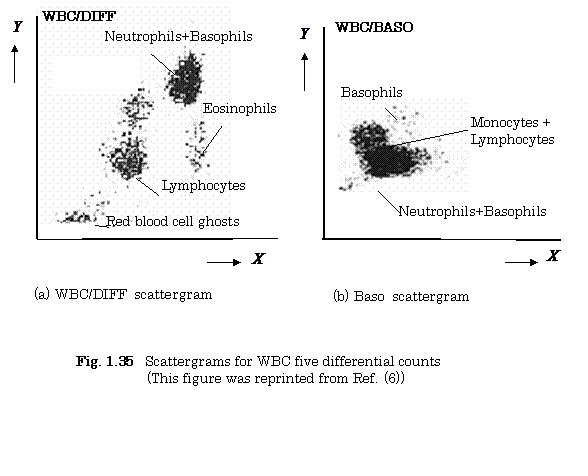
Figure 1.35 shows the two- dimensional scatter-grams for WBC five differential
counts.
(1) In the DIFF channel, lymphocytes, monocytes, eosinophils ,and
eutrophils+basophils are clustered by the chemical processing using the reagent 1,
and
then they are measured by the intensity ![]() of the forward high diverge
of the forward high diverge
scattering beam which depends on the inner structure of the white blood cell, and
the intensity![]() of the forward low diverge scattering beam which depends on
the
of the forward low diverge scattering beam which depends on
the
diameter of the white blood cell . They can be, then ,classified and counted from the
WBC/DIFF scatter-gram shown in Fig.1.35(a).
(2) In the WBC/BASO channel, basophils are separated from red cell ghosts and
other white blood cells by the chemical processing using the reagent 2.
As a result, the normal white blood cells are classified into five categories: neutrophils, eosinophils, basophils, lymphocytes and monocytes, as is shown in Fig.1.35.
1.3 Radar Sensors
1.3.1 Outlines of Radar Sensors
Radar (radio detection and ranging) sensors including sonar (sound navigation and ranging) sensors can determine the range, velocity, and direction of an object.
There are two types of radar sensors: active radar sensors and passive ones.
Firstly, we deal with the active radar sensors. An active radar sensor which radiates a beam of radio wave energy toward the object, receives an echo signal from the object and analyzes its echo signal.
There are three types of radio wave radiations: the pulse modulated wave radiation, the continuous wave (CW) radiation, and the frequency modulated wave radiation.
1.3.2 Pulsed Radar Sensors (19)
Figure 1.36 (a) shows a block diagram of the pulsed radar sensor. It consists of a transmitter, an antenna, a transmit/receive electronic switch (T/R switch), a receiver, and a PPI (plan position indication) display scope.
The operation of this sensor is as follows:
(1) The transmitter sends a narrow width pulsed RF power signal from the antenna toward the object.
(2) The receiver receives the echo signal from the object, and the echo signal is, finally, displayed on the PPI scope after a proper signal processing.
Fig.1. 36(b) shows the relationship between the transmitting signal and its receiving signal.
A
range for the object location can be determined by measuring a round-trip time
of the transmitting signal. The range ![]() is expressed as follows:
is expressed as follows:
![]() (1.4)
(1.4)
where ![]() , and
, and ![]() are the velocity of propagation of the transmitting signal,
and
are the velocity of propagation of the transmitting signal,
and
the round-trip time for the transmitting signal, respectively.
For the radio wave
propagation in a vacuum, ![]() is approximately
is approximately![]() ,
,
whereas for acoustic wave
radiations, ![]() is approximately
is approximately ![]() in air,
in air,
and ![]() in water.
in water.
Next, we will describe several items which express abilities of radar sensors.
(1) The
range resolution ![]() between two objects, satisfies a following relation:
between two objects, satisfies a following relation:
![]() (1.5)
(1.5)
where ![]() is the pulse width of the transmitting signal.
is the pulse width of the transmitting signal.
(2) The smallest range ![]() satisfies the following relation, as is evident from
satisfies the following relation, as is evident from
Fig. 1. 36(b):
![]() (1.6)
(1.6)
where ![]() is the pulse width of the transmitting signal.
is the pulse width of the transmitting signal.
(3) The
maximum range![]() satisfies the following relation:
satisfies the following relation:
![]() (1.7)
(1.7)
where ![]() is the pulse repetition period of the transmitting signal.
is the pulse repetition period of the transmitting signal.
(4)
The detectable maximum range ![]() is expressed as
follows:
is expressed as
follows:
![]() ,
, ![]() (1.8)
(1.8)
where ![]() is the transmitting average power,
is the transmitting average power, ![]() is the transmitting peak power,
is the transmitting peak power, ![]() is the minimum
receivable power ,
is the minimum
receivable power , ![]() is the wavelength of
the transmitting signal ,
is the wavelength of
the transmitting signal , ![]() is the effective diameter of the antenna ,
is the effective diameter of the antenna , ![]() is the effective area of the antenna ,
is the effective area of the antenna , ![]() is the efficiency of the antenna , and
is the efficiency of the antenna , and![]() is the radar cross section of the object.(See Ref. (1),p.29.16).
is the radar cross section of the object.(See Ref. (1),p.29.16).
For example, the radar cross
section is approximately![]() for the large spherical object with the radius
for the large spherical object with the radius![]() of
of ![]() .
.
The derivation of Eq.(1.8) is described in problem 1.3.
【Example 1.9 】Determine
the range![]() between the object and the radar sensor, when the round-trip
time of a pulsed radar is
between the object and the radar sensor, when the round-trip
time of a pulsed radar is ![]() .
.
Using Eq.(1.4),
![]()
![]()
【Example1.10】In the pulsed radar sensor shown in Fig. 1.36, we let
![]() ,
,
![]() ,
, ![]() ,
, ![]() ,
, ![]() .
.
Determine the following values:
(1) ![]() , (2)
, (2) ![]() ,(3) Noise level:
,(3) Noise level: ![]() , (4)
, (4) ![]() (5)
(5) ![]() , (6)
, (6)![]() ,
,
where ![]()
![]() ,
,![]() ,
,
![]() ,
,![]() ,
,![]() .
.
(1)![]() , (2)
, (2)![]() ,
,
(3) ![]() ,
,
(4)![]() ,
,
(5)
![]()
![]()
(6)![]()
![]()
![]()
In the modulator shown in Fig. 1.37 (a), the carrier waveform, the modulation waveform, and the modulated waveform are shown in Figs. 1.37 (b), 1.37(c), and 1.37(d), respectively.
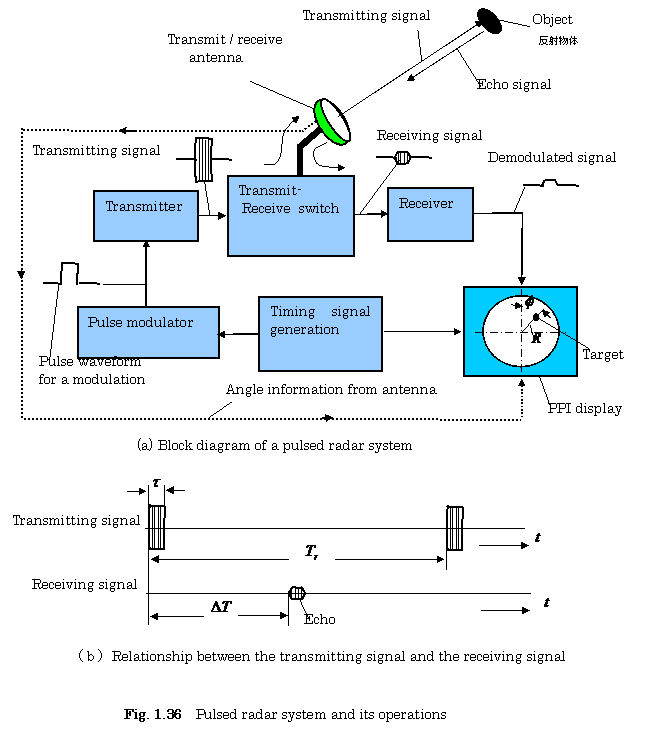
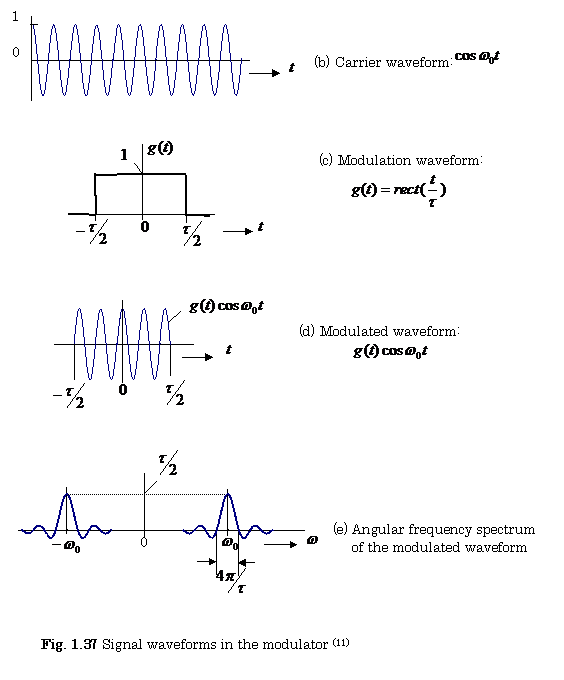
Figure 1. 37(e) is the angular frequency spectrum
of the modulated waveform shown in Fig.1.37(d). The
angular frequency in the continuous carrier wave is![]() (
(![]() :
:
carrier wave frequency)as is evident from Fig.1.37(a). The angular frequency spectrum of modulated wave has, however the wide range of the spectrum for the pulsed modulation, as shown in Fig. 1.37(e).
The
relationship between the modulated signal![]() and its Fourier transform
and its Fourier transform
is expressed as follows:
![]()
![]()
![]()
【Example1.11】Find the Fourier
transform of ![]() ,and
,and ![]() .
.
![]()
![]()
Changing ![]() to
to ![]() , we obtain
, we obtain ![]()
![]()
![]() .
.
【Example1.12】Find the Fourier
transform of ![]() .
.
Using the Euler’s
formula: ![]() , and the results of
, and the results of
Example 1.11, we obtain the following relation:
![]()
![]()
![]()
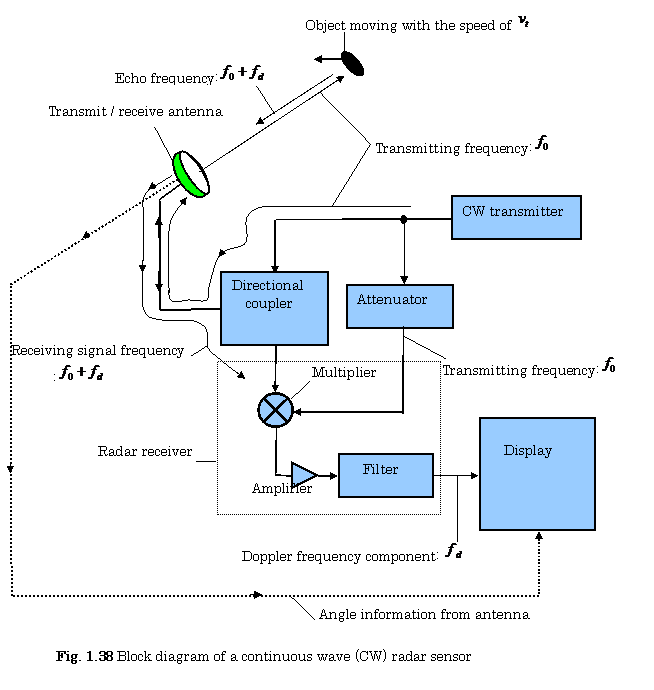
1.3.3 Continuous Wave (CW) Radar Sensor (19)
Figure. 1.38 shows
a simplified block diagram of a CW radar sensor. When the transmitting signal with the carrier
frequency![]() is radiated on the object moving with the speed of
is radiated on the object moving with the speed of ![]() , the frequency of the echo signal is shifted to
, the frequency of the echo signal is shifted to![]() (+ sign expresses the approached direction to the radar sensor).
(+ sign expresses the approached direction to the radar sensor).
In
this situation, the Doppler frequency shift ![]() is expressed as follows:
is expressed as follows:
![]() (1.9)
(1.9)
where![]() is the speed of
propagation of the carrier wave.
is the speed of
propagation of the carrier wave.
【Example 1.13】When ![]() ,
, ![]() , determine
, determine ![]() which is the speed of an object.
which is the speed of an object.
Using
Eq. (1.9), ![]()
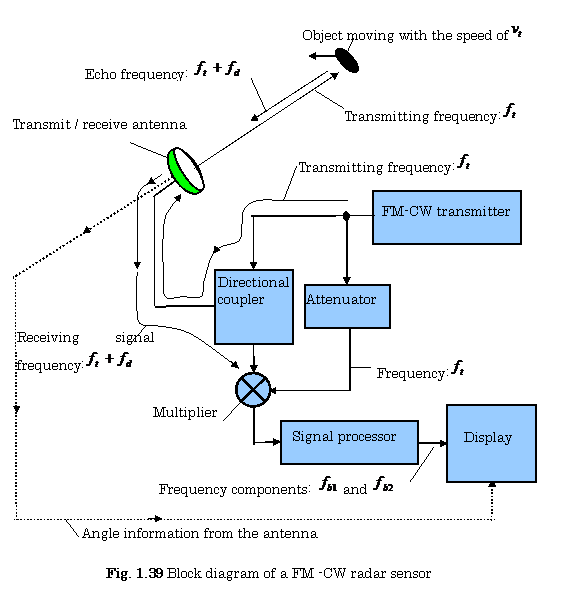
1.3.4 FM Radar Sensor (19)
The CW radar sensor described previously, can’t measure the range between the object and the radar sensor. For a solution of this problem, the frequency of carrier wave is varied as a function of the time in a FM-CW radar sensor.
The
block diagram of the FM-CW radar sensor is shown in Fig. 1.39, and the
relationship between the transmitting signal and the receiving signal are also
shown in Fig.1.40, respectively. Figure.1.40 (a) shows the frequency variation
in the case that the object is moving with the speed of![]() . The transmitting frequency with up chirp is linearly
increased as a function of time, and after that, the transmitting frequency
with down chirp is linearly decreased as the function of time, as is shown in this figure.
. The transmitting frequency with up chirp is linearly
increased as a function of time, and after that, the transmitting frequency
with down chirp is linearly decreased as the function of time, as is shown in this figure.
The details described above are explained as follows:
(1) The frequency of the carrier wave in the FM-CW radar sensor is expressed as a function of the time in the following form:
![]()
where ![]() is a constant and
is a constant and ![]() is the time.
is the time.
(2) The
values ![]() is the maximum
frequency shifts due to a maximum voltage swing
values of
is the maximum
frequency shifts due to a maximum voltage swing
values of![]() as shown in Fig. 1.40 . The value
as shown in Fig. 1.40 . The value ![]() is the repetition
period of a triangular wave for the FM modulation.
is the repetition
period of a triangular wave for the FM modulation.
(3) The receiving signal is
expressed as:![]() .
.
(4) The value ![]() is the time, when the difference
between the transmitting frequency
is the time, when the difference
between the transmitting frequency ![]() and the receiving
frequency
and the receiving
frequency ![]() equals to
equals to
![]() , i.e.,
, i.e.,![]() .
.
(5) The values ![]() , and
, and ![]() shown in Fig.
1.40(a), are expressed as follows:
shown in Fig.
1.40(a), are expressed as follows:
![]() , and
, and ![]() .
.
The range![]() between the object and the radar sensor is, then, expressed as
between the object and the radar sensor is, then, expressed as
follows:
![]() (1.10)
(1.10)
In the case of the object moving with a speed of![]() , as shown in Fig. 1.40(b),
, as shown in Fig. 1.40(b),
the relationship between the transmitting and receiving frequencies is expressed as follows:
(6) Up chirp frequency:![]()
(7) Down chirp frequency:![]()
(8) From (5), (6), and (7) described above, the range![]() between the object and the radar sensor, is expressed as follows:
between the object and the radar sensor, is expressed as follows:
![]() (1.11)
(1.11)
(9)Doppler
frequency:![]() (1.12)
(1.12)
(10)
Speed of the object:![]() ,
,![]() (1.13)
(1.13)
【Example 1.14】In the FM-CW radar sensor shown in Fig. 1.39, we let
![]() ,
,![]() ,
,![]() .
.
Then
we obtained following data: ![]() ,
,![]() .
.
Determine the range between the object and the radar sensor, and the speed of the object.
From
Fig.1.40 (a), ![]() . Using Eq. (1.11),
. Using Eq. (1.11),
![]()
![]() .
.
Using
Eq.(1.12), ![]() . Using Eq.(1.13),
. Using Eq.(1.13),
.![]() ,
, ![]() .
.
1.3.5 Examples of Radar Sensors for Automotive Use (20)
Radio waves, infrared rays, ultrasonic waves, and visible light rays are used as energy sources in the sensing systems for automotive uses.
Figure. 1.41 shows an example of the architectures of automotive wave sensors for holding securely cars from collisions.
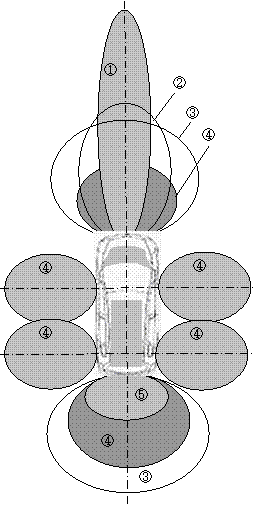
①:Long range sensor using a carrier frequency
of 77(GHz).
Maximum range is approximately 150(m).
②:Infrared sensor.
Maximum range is approximately 120(m).
③:Image sensors.
Maximum range is approximately 80(m).
④:Short range sensors using a carrier frequency
of 24(GHz).
Maximum range is approximately 20(m).
⑤:Sonar sensors, (Maximum range is approximately 3(m))
Details are described in Chapter 3.
Fig. 1.41 Architectures of wave sensors for
holding securely cars from collisions(17)
References:
(13) J.A.Cook,D.McNamara,K.V.Prasad:Control, Computing and Communications:
Technologies for the Twenty-First Century Model T, Proceedings of the IEEE,
Vol.95, No.2, pp.334-355 (2007)
(14) J.Rosen, B. Hannaford : DOC at a DISTANCE, IEEE Spectrum,pp.28-33 (Oct.,2006)
(15) O.Brand: Microsensor Integration Into Systems-on-Chip, Proceedings of the
IEEE , Vol.94, No.6, pp.1160-1176 (2006)
(16) Datasheet, ADXL-203, Analog Devices,
(17)Overview of Automated Hematology analyzer SF-3000TM,Product Development
Division, Sysmex Corporation, Sysmex Journal,Vol.18, pp.11-22(1995)
[ BWW Society Home Page ]
© 2009 The Bibliotheque: World Wide Society