Fundamentals and Practices of Sensing Technologies
by Dr.
Keiji Taniguchi, Hon. Professor of
Xi’ an
Dr. Masahiro Ueda, Honorary
Professor, Faculty of Education and Regional Studies
Dr. Ningfeng Zeng, an
Engineer of Sysmex Corporation
(A Global Medical
Instrument Corporation),
Dr. Kazuhiko Ishikawa,
Assistant Professor
Faculty of Education and
Regional Studies,
[Editor’s
Note: This paper is presented as Part XIV of a series from the new book
“Fundamentals and Practices of Sensing Technologies”]
Chapter Six – Part II
6.4 Charge-to-Mass Ratio
Sensor for Toner Particles
6.4.1 Introduction
The electric charge (q) to the mass (m) ratio q/m of toner
particles plays an important role for developing the quality of printers or
copy-machine systems. For this reason, the small size of apparatus measuring
q/m is desired for on- line use.
As already reported in the literature (10) (11), we have
developed a transparent-electrode method for observing the movement of a toner
particle using an optical microscope for off-line use.
Furthermore, as a new method (12), we present here the method
for measuring Σ(q/m) at the end of the flow path in a toner
transport system driven by a traveling wave for on-line use.
6.4.2
Principle and Method
A. Principle
(13)
Figure 6.15 illustrates the relationship between toner particles
above a sheet of the printed periodic array-conductors driven by the four phase
rectangular pulses and parallel electrodes for sensing charged toner particles.

Let us consider the situation that a toner particle is moved
toward parallel (sensing) electrodes placed at the end of left side of the
transportation system.
In the air gap between parallel electrodes shown in Fig.6.16, the
following two forces act on the toner particle. The image force is neglected
here.

(1) The Coulomb
force ![]() due to the electric
field caused by the power source is given
due to the electric
field caused by the power source is given
as follows: ![]() (6.7)
(6.7)
Where, ![]() ,
, ![]() and
and ![]() are the charge of a
toner particle, the voltage applied across parallel electrodes and the air gap
between parallel electrodes, respectively.
are the charge of a
toner particle, the voltage applied across parallel electrodes and the air gap
between parallel electrodes, respectively.
(2) The gravity
force ![]() is given as follows:
is given as follows: ![]() (6.8)
(6.8)
Where, ![]() and
and ![]() are the mass of the toner particle and the acceleration of
gravity, respectively.
are the mass of the toner particle and the acceleration of
gravity, respectively.
From the relationships between ![]() and
and ![]() , there are three major cases as shown in Fig.6.16.
, there are three major cases as shown in Fig.6.16.
Case
1: ![]() (6.9)
(6.9)
In this case, the charged toner particle moves from the air gap
between parallel electrodes toward the lower electrode.
Case
2: ![]() (6.10)
(6.10)
In this case, the charged toner particle passes through the air
gap between parallel electrodes. From Eq.(6.10), q/m can be expressed in the
following form:
![]() (6.11)
(6.11)
Case
3: ![]() (6.12)
(6.12)
In this case, the charged toner particle moves from the air gap
between parallel electrodes toward the upper electrode. First of all, let us
consider the case when a charged toner particle moves from the air gap between
parallel electrodes toward the upper electrode. As a result, the signal induced
in parallel electrodes by the charged toner particle may produce a voltage![]() across the resister R and this signal is amplified by using
the differential amplifier as shown in Fig. 6.17.
across the resister R and this signal is amplified by using
the differential amplifier as shown in Fig. 6.17.
From ![]() , we can obtain the charge
, we can obtain the charge ![]() of the toner particle (See
Fig.6.17):
of the toner particle (See
Fig.6.17):
![]() (6.13).
(6.13).
If ![]() is satisfied, the
following relation is obtained from Equations (6.11) and (6.13):
is satisfied, the
following relation is obtained from Equations (6.11) and (6.13):
![]() (6.14).
(6.14).
The model of the signal
sensed due to a toner particle is shown in Fig.6.17 (a).
Secondly, let us consider the case when massive charged toner
particles move from the air gap between parallel electrodes toward the upper
electrode.
As shown in Fig.6.17 (b), ![]() is expressed in the
following form by summing up
is expressed in the
following form by summing up ![]() :
:
![]() (6.15).
(6.15).

From Eqs.(6.14) and (6.15),we
can obtain the following relations
:
![]() (6.16)
(6.16)
Where,![]() , and
, and ![]() ,
,![]() , and
, and ![]() are the number of charged toner particles, time delay of
charged toner particles, and total mass of charged toner particles,
respectively.
are the number of charged toner particles, time delay of
charged toner particles, and total mass of charged toner particles,
respectively.
Thirdly, furthermore, let us
consider in the case where the voltage applied across parallel electrodes is
increased to the magnitude of ![]() , where
, where ![]() is the small increase of
is the small increase of ![]() . In
this case, we can express Σ(q/m) by the following form:
. In
this case, we can express Σ(q/m) by the following form:
![]() (6.17).
(6.17).
From
Eqs. (6.16) and (6.17), the difference ofΣ(q/m) is calculated as follows:
![]() (6.18).
(6.18).
B.
Experimental System
The schematic diagram of the experimental system for sensing Σ(q/m) is shown in Fig.6.18. This system consists of the following
parts: the four-phase rectangular pulse generator, the sheet printed periodic
array-conductors for transporting charged toner particles, the DC power source
for supplying the voltage to parallel electrodes and the personal computer for
analyzing the output signal.
The air gap between parallel
electrodes is about 1000mm. By shifting the electric curtain generated
above the periodic array-conductors, the charged toner particles are moved
toward the air gap between the parallel electrodes placed as a sensor.
The signal picked up by the parallel electrodes is amplified using
the differential amplifier. The amplified signal![]() is sent to the analog input of the A-D conversion board in
the personal computer as shown in Fig.6.18.
is sent to the analog input of the A-D conversion board in
the personal computer as shown in Fig.6.18.

Figures6.19 shows the
structure of the sheet of periodical-array-conductors for the transportation of
toner particles. The periodical-array-conductors are connected to the
four-phase rectangular pulse generator.

Figure6.20 shows typical examples of toner particles
transported by electric fields due to the four-phase rectangular pulses in
different times![]() .
.

6.4.3
Results
Spherical toner particles are used for this experiment. The values of
voltage and frequency generated by four-phase rectangular pulse generator are
100(V) and 100(Hz), respectively. Regarding Σ(q/m)
of charged toner particles, we assume here that some samples in the flow of
transportation may have uniformly distribution.
Figure
6.21 shows the output signal ![]() of the sense amplifier
in the case when the voltage
of the sense amplifier
in the case when the voltage ![]() applied across the
sense electrodes is 1.9 (V). In this figure, the induced
applied across the
sense electrodes is 1.9 (V). In this figure, the induced
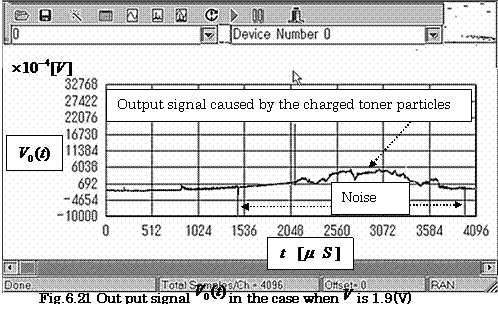
noise pulses caused by four- phase
rectangular pulses are only seen in the output of the amplifier. These are
reduced at the last stage of the sensing circuit using a low pass filter.
Figure
6.22 shows the relationship between voltage ![]() applied across parallel electrodes and the normalized values
of Σ(q/m) for charged toner particles obtained
by applying Eq. (6.16). From Fig.6.22, the distribution of Σ(q/m) for the charged toner particles is calculated by the
following equation:
applied across parallel electrodes and the normalized values
of Σ(q/m) for charged toner particles obtained
by applying Eq. (6.16). From Fig.6.22, the distribution of Σ(q/m) for the charged toner particles is calculated by the
following equation:

![]()

Figure
6.23 shows the relationship between Σ(q/m)
and the frequency distribution. From this figure, the distribution
ofΣ(q/m) for charged toner particles of
this method has a good coincidence with that measured
by E-Spart method near the peak.
![]()

6.4.4
Improvement of Toner Transportation system (14)
Vibrating
the printed sheet of periodical-array-conductors set up on the ultrasonic
vibrator is very effective for decreasing the amplitude of four phase
rectangular pulses.
The connection
between the sheet of array conductors and the ultrasonic vibrator is executed
by the use of a sheet of either a glass plate or an expanded polystyrene plate
as an interface.
Table 6.8 shows the relationship between the amplitude
of four-phase rectangular pulses and the vibration effects.

|
|
100Hz |
200Hz |
|
No vibration |
100v |
100v |
|
Vibration on glass plate |
30v |
35v |
|
Vibration on expanded
polystyrene plate |
24v |
22v |
From this table,
the expanded polystyrene plate put between the sheet of array conductors and
the ultrasonic vibrator shows better transfer effect than the glass one.
The sheet of these
conductors driven by the four-phase rectangular pulses is swung to
the vertical direction by the ceramic vibrator driven by the sinusoidal wave
generator. Consequently, for the toner particles are floated over the sheet of
printed conductors, the adhesive forces acting between toner particles
and the sheet of them are greatly decreased. As a result, the toner particles
can be easily transported to the direction of the other end of the sheet with
the low level amplitude of four-phase rectangular pulse voltage. From the
result of this experiment, the best operational condition is that the drive
frequency of the ceramic vibrator (Produced by Murata Manufacturing Co. Ltd) is
19KHz and the amplitude of the four-phase rectangular pulse voltage in this
situation is 18 volt.
6.5 Active
Sensor for Bearing Wear
6.5.1.
Introduction
A
power transmission shaft is usually provided with a bearing in order to limit
vibrations which are a direct consequence of revolution. As such, the bearing
is one of the most important components of a power transmission shaft. Many
studies and publications concerning oil contamination caused by bearing wear
have been developed15),16) since too much bearing wear contributes
to the risk of failure. We have developed a simple method for estimating
bearing wear by investigating oil contamination using colorimetric analysis17),18).
The method is not, however, direct estimation of the bearing wear. In the past,
bearing wear could be measured directly only by overhauling the pump system,
which is both laborious and costly.
Another
direct detection system for bearing wear without overhauling the pump, in other
words, a system for monitoring vibration in real-time, is therefore highly
desirable for many applications such as in power plants and manufacturing19).
These sensor systems would not only prevent serious failure from occurring, but
can also predict the life span of a bearing. Recently, some sensors to detect
vibration in a transmission shaft and finally to diagnose bearing wear have
been developed by means of an eddy current displacement sensor20),21),
including ours22),23),24), and put into practical use. These
electromagnetic methods are usually superior to the optical method in regard to
a drain pump because the measurement accuracy of this method is not affected by
water contamination, which usually has a great influence on the accuracy of the
optical method. The electromagnetic method can, however, be used only for a
metal shaft because eddy currents are induced only in electrical conducting
materials. Furthermore, this method can measure bearing wear only indirectly;
it shows Lissajous figures for a vibration of the shaft by means of two sets of
displacement sensors mounted close to the shaft at right angles to each other.
We
have proposed a new sensor which can detect bearing wear itself24)
and can be applied for non-metal shafts as well as metal shafts. In this sense,
we call it an “active sensor". This method provides a simple improvement
on an eddy current displacement sensor.
In
this section, we discuss the characteristics of this method when it was applied
practically and show that this sensor can be practically applied for non-metal
shafts as well as to metal shafts.
6.5.2
Principles and Methods
A. Primary
Use of the Sensor
We
have previously developed a system for monitoring the vibration in transmission
shafts using an eddy current displacement sensor22),23). This method
was an indirect method as shown below. Here we briefly summarize the principle
and the method of this system, details of which are given in section 6.5.2.B.
In metal, eddy currents are induced by a time varying electromagnetic field,
and decrease the output of the sensor if the field is sufficiently high in
frequency20),21). Thus in a typical eddy current displacement
sensor, the sensor output diminishes as the target metal approaches the sensor.
Further, the output, P', is linearly proportional to the distance, d, between
the sensor and the metal for a certain range in distance,
|
|
(6.20) |
where k1 is a sensor
sensitivity and is a constant determined by the target metal, the rotor shaft
in this case. The metal size is implied to be sufficiently large in comparison
to the sensor size. The eddy current displacement sensor has usually been used
under this condition, and has been used exclusively as a displacement sensor,
as the name suggests. The sensor can thus be used as a vibration detector if
the data acquisition rate of the sensor is high enough in comparison to the
vibration frequency. As an example, in our previous study22),23) two
sensors were mounted close to the metal shaft at a right angle to each other in
order to observe the two-dimensional motion of the shaft, i.e., the trajectory
of the center of revolution, as shown in Fig. 6.24. An increase in bearing wear
can, therefore, be expressed indirectly by an increase in the area of
trajectory because the shaft moves in all regions bounded by the bearing.

Fig.
6.24 Principle for detecting rotor
vibration by means of an eddy current displacement sensor.
B.
Principle of the “Active Sensor"
However,
strictly speaking, the sensor output, P, will be affected by the effective size
of a target metal, S, across which magnetic flux cuts, as is shown in Fig.
6.25. The sensor output

Fig. 6.25
Electromagnetic flux: (a) in the case of a small target metal, (b) in the case
of a shifted metal.
in this case, P, should be proportional
to the size of the target metal S as well as the distance
of the sensor ,d, and Eq. (6.20) can be
written as follows:
|
|
(6.21) |
where S0 expresses a region
across which all magnetic flux cuts, and k2 is a constant chosen so
that the function f(S/S0) is 0![]() f(S/S0)
f(S/S0)![]() 1; the output P is normalized. A positive sign in front of
the function f indicates that an eddy current decreases the sensor output as
described above. We roughly assumed P=kdS in the previous paper22).
However, the above Eq. (6.21) will be well fitted to discuss the
characteristics of this new method, i.e., an active sensor, as shown below.
1; the output P is normalized. A positive sign in front of
the function f indicates that an eddy current decreases the sensor output as
described above. We roughly assumed P=kdS in the previous paper22).
However, the above Eq. (6.21) will be well fitted to discuss the
characteristics of this new method, i.e., an active sensor, as shown below.
When
the size of the effective target metal, S, is greater than three times that of
the sensor size, it becomes S![]() S0, in which all the magnetic flux cuts across the
metal and produces a maximum eddy current at that distance. This, in turn,
produces the sensor output minimum. Thus, the function f(S/S0)(=
f(1) ) becomes 0, which results in Eq. (6.20). However, f(S/S0)
increases as the size of a target metal diminishes, as is shown in Figure
6.25(a), and finally it becomes 1, i.e., f(0)=1. Such change in the metal size
can be simulated by a horizontal shift of the target metal, as is shown in
Figure 6.25(b). This indicates that metal size can also be measured even if the
distance between the sensor and the target metal, d, is kept constant. That is,
it is expected that a decrease of metal size due to bearing wear can be
measured directly by means of this eddy current displacement sensor. This is
the underlying principle of this method.
S0, in which all the magnetic flux cuts across the
metal and produces a maximum eddy current at that distance. This, in turn,
produces the sensor output minimum. Thus, the function f(S/S0)(=
f(1) ) becomes 0, which results in Eq. (6.20). However, f(S/S0)
increases as the size of a target metal diminishes, as is shown in Figure
6.25(a), and finally it becomes 1, i.e., f(0)=1. Such change in the metal size
can be simulated by a horizontal shift of the target metal, as is shown in
Figure 6.25(b). This indicates that metal size can also be measured even if the
distance between the sensor and the target metal, d, is kept constant. That is,
it is expected that a decrease of metal size due to bearing wear can be
measured directly by means of this eddy current displacement sensor. This is
the underlying principle of this method.
An
ingenious scheme is necessary in order to realize this idea for practical use.
Figure 6.26 provides a conceptual diagram of the method. A thin aluminum plate
or a foil with a
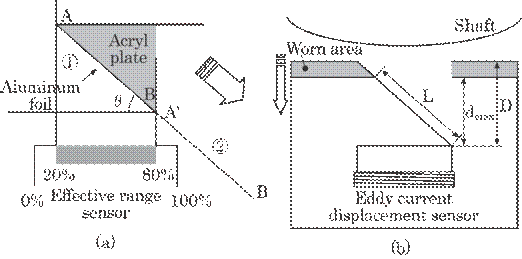
Fig. 6.26
Conceptual diagram of the equivalence between bearing wear and a target metal.
(a) Shift of aluminum
plate, (b) bearing wear.
width of W was pasted onto a wedge-shaped
acrylic plate having an angle of ![]() , which substituted for a target metal. Bearing wear is
simulated by a shift of the acrylic plate away from the metal shaft in the
, which substituted for a target metal. Bearing wear is
simulated by a shift of the acrylic plate away from the metal shaft in the ![]() direction, i.e., from
position
direction, i.e., from
position ![]() to position
to position ![]() in this case, as shown in Fig. 6.26(a). In
practice, the aluminum foil is shaved off by bearing wear as shown in Fig.
6.26(b); the bearing wear can be measured by means of this eddy current
displacement sensor fixed on a bearing. This method can thus measure the
bearing wear itself and be applied for non-metal shafts as well as metal
shafts; in this sense, we call it an “active sensor".
in this case, as shown in Fig. 6.26(a). In
practice, the aluminum foil is shaved off by bearing wear as shown in Fig.
6.26(b); the bearing wear can be measured by means of this eddy current
displacement sensor fixed on a bearing. This method can thus measure the
bearing wear itself and be applied for non-metal shafts as well as metal
shafts; in this sense, we call it an “active sensor".
In
this case, the output of the sensor is affected by both the distance, d, and
the size of the target metal, S, and Eq. (6.21) is reformed as follows:
|
|
(6.22a) |
where dmax is the maximum
value between them, and k3 is a constant so determined that 0![]() g(dmax, S/S0)}
g(dmax, S/S0)}![]() 1 for the normalization of g as mentioned above. The
effective length, L, of the target metal, i.e., effective metal size, S,
decreases linearly with a decrease of dmax, since they are related
by S=Wdmax/sin
1 for the normalization of g as mentioned above. The
effective length, L, of the target metal, i.e., effective metal size, S,
decreases linearly with a decrease of dmax, since they are related
by S=Wdmax/sin![]() , where W is a width perpendicular to this surface, i.e.,
width in depth. Eq. (6.22a) can then be expressed concisely by making these
factors, d and S, into one factor, D-dmax as follows;
, where W is a width perpendicular to this surface, i.e.,
width in depth. Eq. (6.22a) can then be expressed concisely by making these
factors, d and S, into one factor, D-dmax as follows;
|
|
(6.22b) |
where D is the initial maximum distance
between an aluminum plate and a sensor, as is shown in Fig. 6.26(b). Thus, D-dmax,
expressing the amount of bearing wear, can be estimated by the sensor output,
P. The function, g(D-dmax), should be pre-obtained for the practical
application of this method, and it can be used as a calibration curve for the
bearing wear. Eq. (6.22b) expresses a basis for this active sensor.
In
practice, the shaft vibrates at approximately the revolution frequency of the
shaft as was shown previousl23); as such, it approaches the sensor
and then moves away from the sensor periodically. The close proximity of the
shaft to the sensor will decrease the sensor output. However, an alternative
component caused by this vibration of the metal shaft was not taken into in Eq.
(6.22b); that is, the output in Eq. (6.22b) has only direct value. This is
reasonable in an early phase of the bearing wear because the greater part of
the electromagnetic flux reaches the aluminum plate, and the metal shaft has no
effect on the output. However, when the bearing was greatly worn, some part of
the electromagnetic flux reaches the metal shaft. Thus the output P in Eq.
(6.22b) decreases abruptly due to the approach of the metal shaft to the sensor
and increases again abruptly up to the direct value expressed in Eq. (6.22b),
due to increasing distance of the shaft from the sensor. Then the output P
becomes periodic with this revolution frequency, as mentioned above in this
section and further shown later (see Figs. 32 and 33 in section 6.5.3). This
alternative component with this frequency is, however, too high to be cut out
from the direct component by means of low-pass filter, as shown in the previous
study23). In contrast to this alternative component, the direct
component expressed by Eq. (6.22b) increases gradually because the
electromagnetic flux reaching the aluminum plate decreases due to the decrease
of the metal size.
The
data processing procedures are as follows. The output of the eddy current
displacement sensor was amplified to a proper level for digital data
processing. Secondly, the amplified signals were digitized by means of a 14-bit
A/D converter. Finally, the digitized signals were fed into a personal computer
and were normalized and averaged. The computer has other functions such as a
motor drive and data acquisition. The data acquisition rate, i.e., maximum
sampling frequency, of this system was 20kHz. However, the sampling frequency
was 1 Hz in the experiments in this study, since the shift velocity of the
acrylic plate was as small as 50![]() ms-1, and the wear rate in this experiment was
below 1 nms-1. Further, the bearing wear in a practical plant will
be far slower than this value.
ms-1, and the wear rate in this experiment was
below 1 nms-1. Further, the bearing wear in a practical plant will
be far slower than this value.
C. Output
and Processing System
Figure
6.27 shows the measuring system. The principle of the eddy current displacement
sensor is based on a high frequency electro-magnetic field. The eddy currents
are induced within a metal placed in this electro-magnetic field, which changes
the oscillation condition, i.e., amplitude and phase, in the electronic circuit
of the sensor. The amplitude decreases as the sensor approaches a metal, which
determines the output of the sensor. The output is roughly proportional to the
distance between them as shown in Eq. (6.20).
The
output from the sensor is amplified to a proper level for digitization by A/D
converter. These digitized signals are led to a personal computer, processed,
and the results are monitored on a display as shown in Fig. 6.27(b).
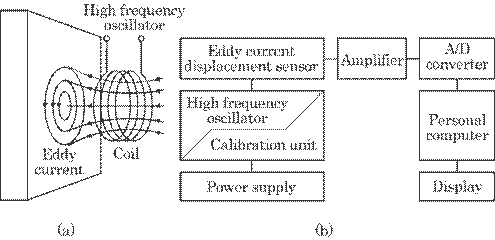
Fig. 6.27
Measuring system. (a) Electronic part of the eddy current displacement sensor
and
(b) data processing
system.
6.5.3
Results and Discussion25,26)
First,
to assure Eq. (6.21), that is, explore a possible practical application of this
method, the sensor output was measured at intervals of 100![]() m horizontal shifts of the aluminum by maintaining a constant
distance between the sensor and the target metal. This simulates a decrease of
effective target size, S, in Fig. 6.26 and Eq. 6.22. Figure 6.28 shows the
results. They resembled each other in shape except regarding the strength of
the absolute output in the area of the usable operating range. Figure 6.28(b)
expresses a normalized sensor output, i.e., the function f(S/S0) in
Eq. 6.22. In this figure, a slight shift of the curve upward (or leftward) as
an increase in distance can be explained as follows. When the displacement
sensor is used at a greater distance from the aluminum plate (e.g. at d=3.0 mm
rather than d=1.0 mm) the spatial resolution of the sensor deteriorates,
causing the edge of the plate to be detected further from the edge. This
deterioration is plainly evident in the curves in Fig. 6.28(a) and, when
normalized, is likely to account for the upward (or leftward) shift in Fig.
6.28(b).
m horizontal shifts of the aluminum by maintaining a constant
distance between the sensor and the target metal. This simulates a decrease of
effective target size, S, in Fig. 6.26 and Eq. 6.22. Figure 6.28 shows the
results. They resembled each other in shape except regarding the strength of
the absolute output in the area of the usable operating range. Figure 6.28(b)
expresses a normalized sensor output, i.e., the function f(S/S0) in
Eq. 6.22. In this figure, a slight shift of the curve upward (or leftward) as
an increase in distance can be explained as follows. When the displacement
sensor is used at a greater distance from the aluminum plate (e.g. at d=3.0 mm
rather than d=1.0 mm) the spatial resolution of the sensor deteriorates,
causing the edge of the plate to be detected further from the edge. This
deterioration is plainly evident in the curves in Fig. 6.28(a) and, when
normalized, is likely to account for the upward (or leftward) shift in Fig.
6.28(b).
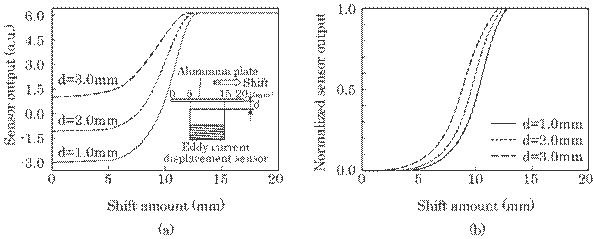
Fig. 6.28
Relation between the sensor output and the amount of horizontal shift of the
acrylic plate (a). Normalization of this output (b).
In this experiment, a sensor size of ![]() =10 mm was used, which determines the extent of the
measurable distance, i.e., a working distance. The working distance is usually
half the sensor size, and was about 5 mm for this sensor. This value is
sufficient since the amount of bearing wear to be measured in a manufacturing
plant is approximately 2 mm.
=10 mm was used, which determines the extent of the
measurable distance, i.e., a working distance. The working distance is usually
half the sensor size, and was about 5 mm for this sensor. This value is
sufficient since the amount of bearing wear to be measured in a manufacturing
plant is approximately 2 mm.
Second,
in order to test the system in terms of its practical use, an aluminum foil
pasted on a wedge-shaped acrylic plate having an angle of ![]() was worn away with a
grinding wheel. Figure 6.29 shows the experimental setup. An eddy current
displacement sensor was fixed on
was worn away with a
grinding wheel. Figure 6.29 shows the experimental setup. An eddy current
displacement sensor was fixed on
a wedge-shaped acrylic plate, and this
united body was pressed against a grinding wheel at a constant pressure, which
simulates practical bearing wear. Three wedge-shaped plates with ![]() =18.6
=18.6![]() , 15.6
, 15.6![]() , and 12.6
, and 12.6![]() were used to examine the sensitivity for bearing wear, i.e.,
the ratio of output increment to wear increment.
were used to examine the sensitivity for bearing wear, i.e.,
the ratio of output increment to wear increment.
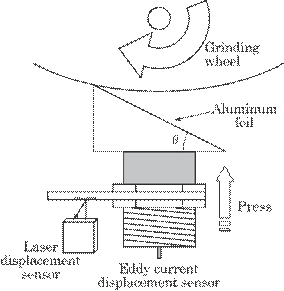
Fig. 6.29 Experimental
setup for simulated bearing wear, i.e., for a non-metal shaft.
Figure
6.30 shows the result obtained by means of this setup, which is a function of
g(D-dmax) in Eq. (6.22) for a non-metal shaft; this expresses a
correction curve for the bearing wear. The wear amount, D-dmax, was
measured by means of a laser displacement sensor with a precision of 1![]() m. The extent of the measurement was rather small in this
case, i.e., 0~1.7 mm, in that the extent of measurement in a practical context
is 2mm at maximum and excluding corrosion. All three curves have similar
characteristics except for a small change in sensitivity, and further resembled
those in Fig. 6.28. Similar experiments were performed using wedge-shaped
plates at angles above 20
m. The extent of the measurement was rather small in this
case, i.e., 0~1.7 mm, in that the extent of measurement in a practical context
is 2mm at maximum and excluding corrosion. All three curves have similar
characteristics except for a small change in sensitivity, and further resembled
those in Fig. 6.28. Similar experiments were performed using wedge-shaped
plates at angles above 20![]() . They all share similar characteristics. This can be
predicted from the result shown in Figure 6.28(b) showing that the shape of the
normalized output was hardly affected by the distance, d, but by the effective
metal size, S. That is, an increase in output depends largely on a decrease in
the effective target size, S, due to bearing wear because the angle of the
wedge-shaped plate is rather small; a small change in distance results in a
large decrease in effective target size. The angle should, rather, be
determined by such factors as sensor size, i.e., the working distance of the
sensor, and the amount of bearing wear to be measured. The relation between
sensor output and wear amount shown in Fig. 6.30 expresses bearing wear itself
for the non-metal shaft.
. They all share similar characteristics. This can be
predicted from the result shown in Figure 6.28(b) showing that the shape of the
normalized output was hardly affected by the distance, d, but by the effective
metal size, S. That is, an increase in output depends largely on a decrease in
the effective target size, S, due to bearing wear because the angle of the
wedge-shaped plate is rather small; a small change in distance results in a
large decrease in effective target size. The angle should, rather, be
determined by such factors as sensor size, i.e., the working distance of the
sensor, and the amount of bearing wear to be measured. The relation between
sensor output and wear amount shown in Fig. 6.30 expresses bearing wear itself
for the non-metal shaft.
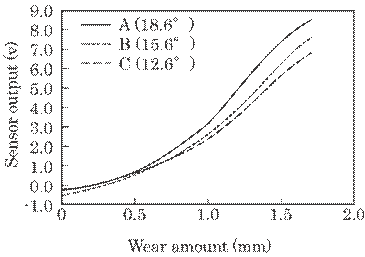
Fig. 6.30
Relation between the sensor output and the amount of bearing wear obtained by
the
experimental setup shown
in Figures 6 and 8.
Finally,
the main experiments in this section, which simulate approximately a practical
use for the metal shaft, were carried out by means of the experimental setup
shown in Figure 6.31. In order to simulate a practical metal shaft, a circular
stainless steel disk of thickness
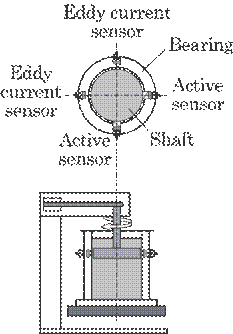
Fig. 6.31
Experimental setup for practical bearing wear, i.e., for a metal shaft.
20 mm and diameter 100 mm was fixed to
one end of the motor shaft of a drilling machine, and was immersed in a brass
cylinder filled with water. The cylinder has an inner diameter of about 101 mm,
thickness of 15 mm and a height of 200 mm, which simulates the bearing. The
“active sensor" developed in this study was embedded into this vessel
wall. A rough side-face of the disk was used to increase bearing wear. The
bearing wear was induced by the vibration of the disk, i.e., run-out of the
disc center to the revolution center, due to centrifugal force and a slight
eccentricity of the disk to the revolution center, as discussed in the previous
paper22).
Figure
6.32 expresses the result showing the relation between sensor output and
bearing wear, which simulates practical use of the sensor. In this figure,
curve (a) was obtained for a
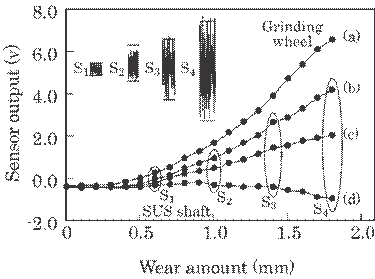
Fig. 6.32
Relation between the sensor output and the amount of bearing wear obtained by
the
experimental setup shown in Figure
6.27. Curve (a) was obtained for a grinding
wheel, i.e., a non-metal
shaft, (b) for a metal shaft distant from the sensor within a
vibration amplitude, (c) for a metal
shaft on the revolution center, and (d) for a
metal shaft in close
proximity to the sensor.
grinding wheel, i.e., for a non-metal shaft,
(b) for a metal shaft distant from the sensor within a vibration amplitude, (c)
for a metal shaft on the revolution center and (d) for a metal shaft in close
proximity to the sensor. As discussed in 6.5.2B, the output, (b), for the metal
shaft is always lower than that, (a), for the non-metal shaft, even when the
metal shaft is distant from the sensor. This decrease depends on the
construction of the “active sensor" in relation to the bearing, i.e., the
vibration amplitude of the metal shaft. The output, (d), is lowest of all and
is also dependent on the construction, because a great part of the magnetic
flux which reduces the output reaches the metal shaft. Therefore a practical
output signal will be sinusoidal with a peak-to-peak amplitude between the curves
(b) and (d) and with a revolution frequency, as predicted in this figure, s1~s4.
Figure
6.33 shows some examples of this practical signal on the display. The center of
this output lies on the curve (c) in figure 6.32. The result was obtained in a
period of about a
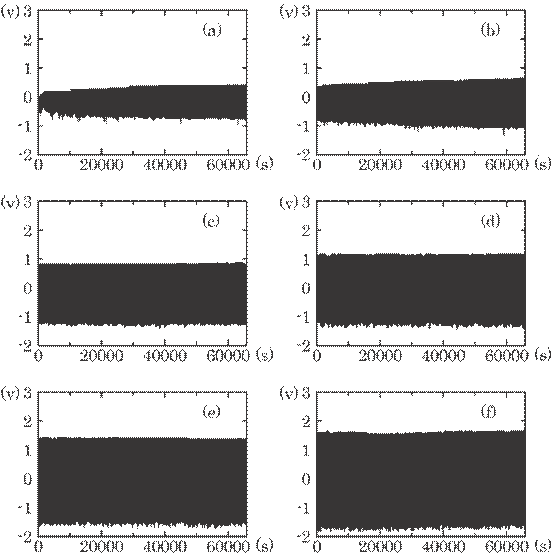
Fig.
6.33 Real time signal expressing bearing
wear: (a) after 12 h, (b) after 24 h, (c) after 3
days,
(d) after 1 week, (e) after 2 weeks and (f) after 1 month. (The sampling
frequency is 1 Hz)
month of continuous operation because the
bearing wear was extremely small in water, about a few tenths that in air. In
water, rolling friction between shaft and bearing decreases greatly since water
acts as lubricant, which decreases rolling friction and heating due to this friction.
The sinusoidal signal can easily be rectified by a low-pass filter. These
results shown in Figs .632 and 6.33 can thus be used to estimate the bearing
wear in a practical installation.
The
measurement error of this sensor can be estimated to be about 20 ![]() m based on a small ripple in Figure 6.30. In this experiment,
the amount of bearing wear was measured by means of a laser displacement sensor
with a measurement error of 1
m based on a small ripple in Figure 6.30. In this experiment,
the amount of bearing wear was measured by means of a laser displacement sensor
with a measurement error of 1 ![]() m. The error due to the electronic circuit including an error
caused by quantification of the 14 bit A/D converter was about 2
m. The error due to the electronic circuit including an error
caused by quantification of the 14 bit A/D converter was about 2 ![]() m as was shown in the previous paper22), which was
obtained when no signal was passed from the sensor. The main measurement error
of this sensor was caused by the abrupt wearing away of the acryl plate, which
seemed to be caused by local heating due to sliding friction. The measurement
error of about 20
m as was shown in the previous paper22), which was
obtained when no signal was passed from the sensor. The main measurement error
of this sensor was caused by the abrupt wearing away of the acryl plate, which
seemed to be caused by local heating due to sliding friction. The measurement
error of about 20 ![]() m was, however, small enough with regard to our practical
purposes.
m was, however, small enough with regard to our practical
purposes.
In
this section, an aluminum plate and a piece of aluminum foil were used
exclusively since they were not only easy to obtain but could also be easily
worn away. However, in terms of specific practical applications, other metal
foils such as gold foil and titanium steel can be used, i.e., metals that would
not corrode in seawater, since eddy currents are induced in all metals. In all
cases, a calibration curve for the corresponding metal should, of course, be
pre-obtained for the practical use of this method.
In
conclusions, the following results were obtained.
(1) The sensor unites an eddy current
displacement sensor and a metal foil sandwiched between wedge-shaped acrylic
plates in a body.
(2) The measurement error of this sensor
system is about 20 ![]() m, which is sufficiently small for practical bearing
monitoring applications.
m, which is sufficiently small for practical bearing
monitoring applications.
(3) The whole system consists of this
sensor, a data processing system including an amplifier, a 14-bit A/D
converter, a personal computer, and a display.
References
in Chap. 6 Part II:
10)
Y.Yamamoto,K.Taniguchi,H.Yamamoto,K.Matsubara: “A New Technique for
Measuring the Charge-to-Mass Ratio q/m of a Toner Particle", IS&T's
10th International Congress on Advances in Non-Impact Printing Technologies,pp.165-167(1994)
11) H.
Yamamoto, K. Taniguchi, a, Y. Nakano, Y. Yamamoto, and Y. Takahara :A Method
for Measuring the Charge to Mass Ratio of a Spherical Toner Particle, Trans.
IEE
12)
H. Yamamoto, K. Taniguchi, Y. Takahara, Y. Nakano, Y. Yamamoto,
and
S.Watanabe: Measurement of the tribo-charge values on a surface of a Spherical
Toner Particle, Trans. IEE Japan,,120-E,12, pp. 582-587(2000)
13) K.
Taniguchi, H. Yamamoto , Y. Nakano, T. Sakai, S Morikuni, S. Watanabe and
Y.Yamamoto: A New Technique for Measuring the distribution of Charge -to- Mass
Ratio for Toner Particles with On-Line Use, Journal of Imaging Science and
Technology, Vol.47, No.3, pp.224-228 (2003)
14)
K.Taniguchi, T.Yagi, Y.Nakano, T.Sakai, H.Yamamoto, and S.Watanabe“An
Improved Technique for Driven
Characteristics for Toner Transportation", IS&T's NIP17: International
Conference on Digital Printing Technologies, pp.856-859 (2001)
15)
L.B.Schein:Electrophotography and Development Physics, 2nd edition,
Springer-Verlag,
p.211(1992)
16) E.
Ioannides, & B. Jacobson: Dirty lubricants-reduced bearing life, Ball
Bearing Journal Special 89(1989) p. 22.
17) A.
Sasaki, S. Uchiyama, S. Kawasaki, S. Sjoeberg, K. Leola, & Reed T:
Criticism on oil cleanliness standard and suggestion of a new method, 1997
Proc. Fifth Scandinavian Int'l. Conf. Fluid Power, SICFP 97(1997) p.243.
18) T.
Yamaguchi, S. Kawaura, T. Honda, M. Ueda, A. Sasaki, & Y. Iwai:
Investigation of oil contamination by colorimetric analysis, 2002 J. Soc.
Tribol. Lubr. Engr. 58-1(2002) p. 12
19) T.
Yamaguchi, T. Honda, Y. Iwai, M. Ueda, & A. Sasaki: Investigation of oil
contamination by colorimetric analysis, Mem. Fac. Eng. Fukui Univ. 51-1(2003)
p. 81.
20) Ed.
Soc. Tech. Diagnosis: A report on a technical development for a detection and a
diagnosis of a light water reactor - techniques for a diagnosis of fatigue
B1-B28(2001) .
21) B.
Nicola, & H. Yongqiang: Electrical conductivity measurement of metal plates
using broadband eddy-current and four-point methods, Meas. Sci. Technol.
16(2005) p. 2193.
22) W.
Yin, S. J. Dickinson, & A. J. Peyton: A multi-frequency impedance analyzing
instrument for eddy current testing, Meas. Sci. Technol. 17(2006) p.393.
23)
N. Ichinose: 1998 Industrial Materials 47-8 17 Jpn.
24) Y.
Sotoyama, S. Ishizuka, T. Hirata, T. Sekino, T. Ogawa, T. Kuronuma, H.
Ninomiya, Z. Dai, & T. Yamazaki: EBARA Topical Report 188 34(2000) Jpn.
25) T.
Yamaguchi, Y. Iwai, S. Inagaki, & M. Ueda: Vibration monitoring system for
a transmission shaft in real time using an eddy current displacement sensor,
Trans. Soc. Instrum. Control Engr. 38-12(2002) p. 1129.
26) T.
Yamaguchi, Y. Iwai, S. Inagaki, & M. Ueda: A method for detecting bearing
wear in a drain pump ustilizing an eddy-current displacement sensor,
Measurement 33-3(2003) p. 205.
27) T.
Yamaguchi, & M. Ueda: An active sensor for monitoring bearing wear by means
of an eddy current displacement sensor, Meas. Sci. Technol. 18(2007) p. 311.
[Editor’s
Note: This concludes Chapter 6; the final chapter of this book,
Chapter 7,
will appear in the upcoming July-August 2011 issue of this Journal.]
[ BWW Society Home Page ]
© 2011 The Bibliotheque: World Wide Society