Fundamentals and Practices of Sensing Technologies
by Dr.
Keiji Taniguchi, Hon. Professor of
Xi’ an
Dr. Masahiro Ueda, Honorary
Professor, Faculty of Education and Regional Studies
Dr. Ningfeng Zeng, an
Engineer of Sysmex Corporation
(A Global Medical
Instrument Corporation),
Dr. Kazuhiko Ishikawa,
Assistant Professor
Faculty of Education and
Regional Studies,
[Editor’s
Note: This paper is presented as Part X of a series from the new book
“Fundamentals and Practices of Sensing Technologies”; subsequent chapters will
be featured in upcoming issues of this Journal.]
Chapter Five – Part II
5.5 Diameter Sensor for
Polyethylene Filament
5.5.1 Introduction
Polyester fiber has
widely been used mainly in clothes since it provides high thermal insulation,
and a natural draft. In the past few years, the technique for spinning
polyester fiber has been improved in terms of its quality and production
efficiency. The quality of the produced filament is determined by such control
factors as the temperature of polyester solution, the size of the nozzle from
which a polyester solution emitted, the temperature of the cooling air in the
vicinity of the nozzle, the amount of solution emitted from the nozzle, and the
winding speed of the filament onto the reel. In high speed production, the
winding speed is usually about 80 m/s, and the emission speed of the solution
from a nozzle is about 2 m/s. In this case, a neck-like slenderizing arises in
the neighborhood of the nozzle. The filament's quality and its production
efficiency are determined by this slenderizing which, in turn, is determined by
the above mentioned control factors. Thus, primarily as a means of process
control, it is desirable to observe the slenderizing of the fiber during
process in real time.
A CCD camera may be used
for this purpose though it does not possess a high enough resolution for filaments
as fine as a few ![]() m in diameter. However, a scattered light intensity can
successfully be used. A light scattered on a surface can collect much
information regarding a cloth surface; for example, fiber density12),
a mean fiber diameter13),14), and surface roughness.
m in diameter. However, a scattered light intensity can
successfully be used. A light scattered on a surface can collect much
information regarding a cloth surface; for example, fiber density12),
a mean fiber diameter13),14), and surface roughness.
This study reports an
optical method for measuring the change in filament diameter during its
production in a practical plant, i.e., the slenderizing in real time and its
practical system.
5.5.2 Principle and Method
Figure
5.21 shows a rough schematic diagram of the spinning process. Polyester
solution as the raw material of the filament is emitted from a nozzle, from
which a string-like solution is formed. The string-like solution is cooled by
an air current close to the nozzle and is shaped into a drawn-out filament, and
is finally wounded onto a reel. In a high speed spinning process, where the
emission velocity of the polyester solution is about 2 m/s and that of the
drawn-out filament is about 80 m/s, an abrupt change of the filament diameter
called neck-like slenderizing arises in the neighborhood of the nozzle as shown
in a cut in Fig. 5.21. The degree of slenderizing and the position of
slenderizing are determined by such control factors as the temperature and
viscosity of the raw material, the emission and a winding speed, nozzle size,
and cooling power. It is desirable to measure the change of the filament
diameter at the neck-like slenderizing as a process control since the quality
of the filament and its production efficiency are determined by this
slenderizing.
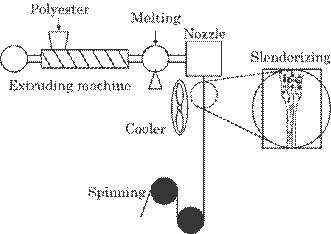
Fig. 5.21 Schematic
diagram of the spinning process.
Neck-like
slenderizing does not occur with a low speed spinning process. In this case,
slenderizing arises gradually over a long length of filament and such a
phenomenon can not be observed. As discussed previously13, 14),
scattered light from the filament provides information regarding its surface,
e.g., its diameter13) and color14). To measure diameter
by means of scattered light intensity, the intensity of the irradiation light
and the distance from the irradiated point to the receiver should be constant.
However, the fluctuation of the filament poses the most difficult problem in
applying the method to a practical production process. Figure 5.22 shows a
prototype of the optical arrangement of measuring the diameter of a polyester
filament. A laser and two light receivers can be used successfully to solve
both problems. In this case, the light intensity of the irradiation is constant
within a laser beam. The other problem that the filament fluctuates, in other
words, the change of distance between the irradiated point and the receiver,
can be solved as follows: two light receivers placed on each side of the
filament at an angle of ![]() to the laser beam are
used to estimate the position of the filament; one is used for front scattering
light IF and the other is used for back scattering light IB
as shown in this figure. Both scattered light intensities on the receivers, IF
and IB, are same at a chosen filament position,
to the laser beam are
used to estimate the position of the filament; one is used for front scattering
light IF and the other is used for back scattering light IB
as shown in this figure. Both scattered light intensities on the receivers, IF
and IB, are same at a chosen filament position, ![]() .
But when a position is shifted slightly to
.
But when a position is shifted slightly to ![]() or
or ![]() due to the fluctuation of a filament, both
intensities will be different from each other as shown in a cut in Fig. 5.22.
The light intensity at a distance R from a light source with an intensity IO
is given by I=IO/(4
due to the fluctuation of a filament, both
intensities will be different from each other as shown in a cut in Fig. 5.22.
The light intensity at a distance R from a light source with an intensity IO
is given by I=IO/(4![]() R2). An increment of the light intensity,
R2). An increment of the light intensity, ![]() I, due to an increment of the distance,
I, due to an increment of the distance, ![]() R, can, then, be expressed as follows,
R, can, then, be expressed as follows,
|
|
(5.16) |
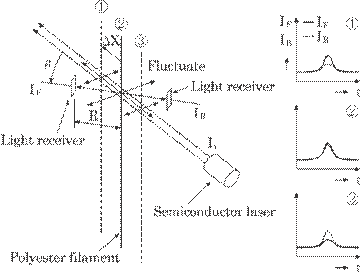
Fig. 5.22 Prototype of
the optical arrangement for measuring polyester diameter.
The
intensity difference between both receivers at the filament positions ![]() and
and ![]() ,
,
![]() , is then
, is then
|
|
(5.17) |
This
enables us to estimate the position of the filament. That is, in practice, we
can obtain a signal from a small area around a predetermined point, i.e., ![]() ,
where both scattered intensities are almost the same within a given difference
,
where both scattered intensities are almost the same within a given difference ![]() ,
, ![]() <
<![]() . The value of
. The value of ![]() can be determined by
the measurement error of the scattered light intensity. The distance between
the irradiated filament and the receiver was about R=40 mm from a practical
point of view. The intensity change within -1 mm <
can be determined by
the measurement error of the scattered light intensity. The distance between
the irradiated filament and the receiver was about R=40 mm from a practical
point of view. The intensity change within -1 mm < ![]() R < 1 mm will then be is
R < 1 mm will then be is ![]() /I = 0.05 from Eq. (5.16). But as was shown in section 5.5.3,
a dependence of scattered light intensity on a direction was larger than that
of distance. We can not, therefore,, determine whether or not a signal
originated from -1 mm <
/I = 0.05 from Eq. (5.16). But as was shown in section 5.5.3,
a dependence of scattered light intensity on a direction was larger than that
of distance. We can not, therefore,, determine whether or not a signal
originated from -1 mm < ![]() R < 1 mm. This was discussed in section 5.5.3. Thus,
another optical system will be required to attain higher positional
sensitivity.
R < 1 mm. This was discussed in section 5.5.3. Thus,
another optical system will be required to attain higher positional
sensitivity.
Figures 5.23 (a) and (b)
show an improved optical arrangement. This configuration differs from the
prototype where focused light was used; a light from a semiconductor laser was
defocused by an objective lens and was then focused by a cylindrical lens.
Figure 5.23(a) illustrates a whole sensor head and the intensity at each
position. Figure 5.23(b) shows a cross section of the sheet laser. We can make
the light intensity very high at the focused position, i.e., a waist position, and
then detect a signal from only the waist position as follows.
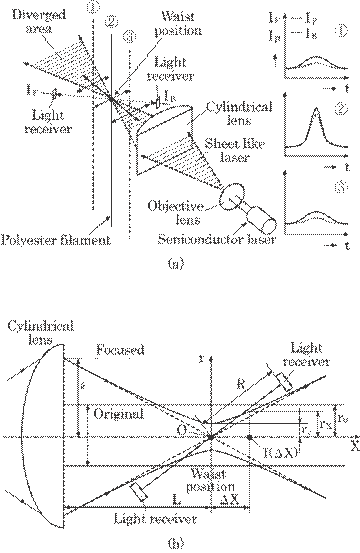
Fig. 5.23 (a) Improved optical arrangement of
the prototype, (b) cross section of the sheet laser.
The
laser sheet of width 2a at the cylindrical lens was focused to the minimum
width 2rc at a waist position. The light intensity at this point Ic
is, then, increased to Ic = (r0/rc)I, where r0
is a radius of the original laser, i.e., a width of the laser sheet, from a
semiconductor laser. The light intensity at a distance ![]() X from the waist position, I(
X from the waist position, I(![]() X), can then be expressed roughly as
X), can then be expressed roughly as
|
|
(5.18) |
In
this equation, L is a distance between the cylindrical lens and the waist
position, and 2rX is the width at ![]() X. Thus, light intensity I changes inversely to the increment
X. Thus, light intensity I changes inversely to the increment
![]() X, in contrast to the prototype arrangement shown in Fig.
5.22. The position detection of the filament can be performed as follows. First,
the light intensity scattered on a filament at the waist position, Ic,
was measured. Second, the intensity at any point
X, in contrast to the prototype arrangement shown in Fig.
5.22. The position detection of the filament can be performed as follows. First,
the light intensity scattered on a filament at the waist position, Ic,
was measured. Second, the intensity at any point ![]() X, I(
X, I(![]() X), was measured and normalized to Ic, I(
X), was measured and normalized to Ic, I(![]() X) /Ic. Finally, only the normalized intensity
greater than a given value S was obtained as a signal. The value of S can be
determined by a tolerable maximum value of
X) /Ic. Finally, only the normalized intensity
greater than a given value S was obtained as a signal. The value of S can be
determined by a tolerable maximum value of ![]() X which is determined by the measurement error of the
received light intensity. Thus, the improved method uses the intensity
difference between Ic and I(
X which is determined by the measurement error of the
received light intensity. Thus, the improved method uses the intensity
difference between Ic and I(![]() X) at a different instance of the measurement. In contrast,
the previous method uses an intensity difference between IF and IB
at the same instance. It is obvious from Eq. (5.18) that a high positional
sensitivity, in other words, a large decrease in I(
X) at a different instance of the measurement. In contrast,
the previous method uses an intensity difference between IF and IB
at the same instance. It is obvious from Eq. (5.18) that a high positional
sensitivity, in other words, a large decrease in I(![]() X) due to
X) due to ![]() X, can be obtained by small rc and L and by large
a. The values rc and L are determined mainly by the focal length of
the cylindrical lens, and small values of rc and L can be obtained
by using a lens with small focal length. In our spinning process, the
string-like solution from the nozzle was, however, 100
X, can be obtained by small rc and L and by large
a. The values rc and L are determined mainly by the focal length of
the cylindrical lens, and small values of rc and L can be obtained
by using a lens with small focal length. In our spinning process, the
string-like solution from the nozzle was, however, 100 ![]() m in diameter and that of the drawn-out filament was 15
m in diameter and that of the drawn-out filament was 15 ![]() m in diameter. The cylindrical lens with a focal length of 30
mm and L
m in diameter. The cylindrical lens with a focal length of 30
mm and L![]() 50 mm was, then, used to obtain rc
50 mm was, then, used to obtain rc![]() 200
200![]() m from a practical point of view. Thus, for a laser beam
diameter of 1 mm(=2r0), i. e., laser beam width, the intensity at
the waist position can be 5 times high and this leads to a high position
sensitivity as discussed in 5.3.3.
m from a practical point of view. Thus, for a laser beam
diameter of 1 mm(=2r0), i. e., laser beam width, the intensity at
the waist position can be 5 times high and this leads to a high position
sensitivity as discussed in 5.3.3.
Figure 5.24 shows a data
processing system. The received signals, IB and IF, are
amplified to an acceptable signal level for a A/D converter and digitized by a
12-bit A/D converter. The digitized signals are processed by a personal
computer and the results are displayed on the monitor. The computer has three
functions: the first is to detect the signal from only a waist position by
comparing I(![]() X) to Ic, i.e., I(
X) to Ic, i.e., I(![]() X)/Ic>S, the second is to calculate the mean
value between IF and IB, and the last is to calculate a
diameter by means of a predetermined calibration curve between the diameter and
the scattered light intensity, i.e., the mean value
X)/Ic>S, the second is to calculate the mean
value between IF and IB, and the last is to calculate a
diameter by means of a predetermined calibration curve between the diameter and
the scattered light intensity, i.e., the mean value
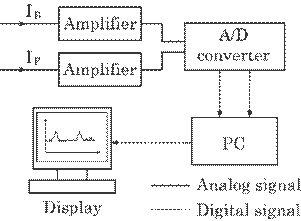
Fig. 5.24 Data processing system.
of
IF and IB in this case. The rate of data acquisition,
i.e., the sampling frequency, was 10 kHz, which was high enough since the
fluctuation frequency of the filament in the production plant was about a few
Hz.
5.5.3 Experimental
Results and Discussions
Figure 5.25 shows an
example of both scattered light intensities, IF and IB,
for the improved optical arrangement. Both intensities changed complicatedly in
time. This can be
Fig. 5.25 Scattered light intensity in real
time. The data acquisition frequency was 10 kHz and the fluctuation frequency
of the filament was about 2 Hz.
explained
as follows. In a practical polyester filament, a few titanic oxide particles
were mixed as a brightener, which act as the light scatterer. The amount of the
particles will, then, change in a moment as the filament passes through an
irradiation portion of the laser, which causes such the intensity change. These
signals are, then, averaged in time and are used for the estimation of the
filament diameter by the above mentioned method. The averaged light intensity
was used in all the experiments in this paper.
Preliminary experiments
were carried out to examine the positional sensitivity for the prototype
optical arrangement shown in Fig. 5.22 and for the improved optical arrangement
shown in Fig. 5.23. In these experiments, all optical components were fixed and
the filament position was changed to X=-2, -1, 0, 1, and 2 mm (Fig. 5.23(b)).
Figure 5.26 shows these results. In these figures, scattered light intensities
are normalized by the intensity Ic at X=0.
Fig. 5.26 Scattered light intensity at various
filament positions. (a) by a prototype optical arrangement, (b) by an improved
optical arrangement.
Both
scattered light intensities for the prototype optical arrangement in Fig. 5.22,
IF and IB, increased with a position shift from -2 mm to
+2 mm (Fig. 5.26(a)). This will be true for IF since the distance
between the light source, i. e., a filament, and the light receiver decreases.
In contrast, it seems that IB will decrease with a position shift
from -2 mm to +2 mm because the distance between the light source and the light
receiver increases. However, the back scattered light intensity IB
increases also. This can be explained by Mie scattering 15) In this
case, the interference occurs in the scattering from a large particle and
causes a directivity of the scattered light intensity, i.e., a complicated
dependence of the scattered light intensity on the scattering direction. That
is, the increase of the received intensity due to the increase of the
directivity is larger than its decrease due to an increase of the distance.
Thus, the prototype optical arrangement can not detect the correct position of
the filament since both scattered intensities, IF and IB,
change in a same manner with the filament position, ![]() X.
X.
Fig. 5.26(b) shows the
normalized light intensity obtained for the improved optical arrangement. In
this case, the intensity becomes maximum at a waist position, ![]() X=0, and decreases with both an increase and decrease of
X=0, and decreases with both an increase and decrease of ![]() X, as is expected theoretically (Eq. (5.18)). The directivity
of the scattered light intensity occurs, of course, in this case. But the
intensity change due to the filament position is far larger than that due to
directivity. Thus, only a signal from the waist position can be obtained by
this improved optical arrangement. That is, the true signal is the one with the
intensity Is greater than Is=I/Ic-
X, as is expected theoretically (Eq. (5.18)). The directivity
of the scattered light intensity occurs, of course, in this case. But the
intensity change due to the filament position is far larger than that due to
directivity. Thus, only a signal from the waist position can be obtained by
this improved optical arrangement. That is, the true signal is the one with the
intensity Is greater than Is=I/Ic-![]() , where the value of
, where the value of ![]() is determined by a
measurement error of the scattered light intensity. The measurement error of
the scattered light intensity
is determined by a
measurement error of the scattered light intensity. The measurement error of
the scattered light intensity ![]() , in a production plant was about 15%. The maximum allowable
error of the filament position
, in a production plant was about 15%. The maximum allowable
error of the filament position ![]() X was, then about
X was, then about ![]() =
=![]() 0.5 mm from the result shown in Fig.5.26(b). The position
sensitivity defined by normalized scattered light intensity I/Ic to
the position change
0.5 mm from the result shown in Fig.5.26(b). The position
sensitivity defined by normalized scattered light intensity I/Ic to
the position change ![]() X, (I/Ic)/
X, (I/Ic)/ ![]() X , was about 0.7 mm-1 as based on the results
shown in Fig. 5.26(b). That is, the signal with the intensity I(
X , was about 0.7 mm-1 as based on the results
shown in Fig. 5.26(b). That is, the signal with the intensity I(![]() X)/Ic > 0.7 will originate in the area -1 mm
<
X)/Ic > 0.7 will originate in the area -1 mm
< ![]() X < 1 mm. Thus, the intensity decreases drastically with
X < 1 mm. Thus, the intensity decreases drastically with ![]() X in this improved optical arrangement.
X in this improved optical arrangement.
Figure 5.27 shows a
relation between the scattered light intensity I and the cross section of the
filament Q. Thus, the light intensity I was linearly proportional to the cross
section of the filament, Q, for polyester diameter d between a few ![]() m and a few tens of
m and a few tens of ![]() m as shown in a following relation.
m as shown in a following relation.
|
|
(5.19) |
This
is rather curious because the scattered light intensity should be proportional
to the irradiated surface. This is true for almost all objects where an
irradiated surface acts as scattering points.
However, the raw
polyester that constitutes polyester filament is nearly transparent to light.
In this case, a few titanic oxide particles were mixed in the polyester
solution as a brightener, which acts as the light scatterer. That is, the
scattered light intensity is proportional to the amount of titanic oxide
particles within the irradiated portion, i.e., the cross section of the
filament since the thickness of the sheet-like laser light is constant.
Fig. 5.27
Relation between scattered light intensity and the cross section of the
filament. An unit of dt in the axis of abscissa expresses deci-texture, where 1
texture is a unit of 1g/1000m of the filament.
The result seen in
Fig.5.27 was used as a calibration curve for an estimation of filament
diameter. An increment of the filament diameter, ![]() d, due to an increment of the light intensity,
d, due to an increment of the light intensity, ![]() I, can be expressed from Eq. (5.19) as,
I, can be expressed from Eq. (5.19) as,
|
|
(5.20) |
Thus,
the measurement error for diameter is half of the measurement error for light
intensity. In this experiment, the measurement error for the diameter was ![]() d/d = 0.08 since the measurement error for the light
intensity was
d/d = 0.08 since the measurement error for the light
intensity was ![]() I/I = 0.15( =
I/I = 0.15( =![]() ). In Fig. 5.27, signals were averaged in time and the
averaged intensity was used for each sample datum. The 20 sample data which
were greater than a properly chosen value were further averaged, and the
averaged value was used for the correct estimation of the filament diameter by
the above-mentioned method.
). In Fig. 5.27, signals were averaged in time and the
averaged intensity was used for each sample datum. The 20 sample data which
were greater than a properly chosen value were further averaged, and the
averaged value was used for the correct estimation of the filament diameter by
the above-mentioned method.
In conclusions, the
following results were obtained.
(1)
The sensor head of the system consists of a semiconductor laser and two
silicon-photodiodes as light receivers.
(2)
The scattered light intensity was proportional to the cross section of the
filament.
(3)
The measurement error for the scattered light intensity was 15 % of the maximum
intensity at the waist position of the laser beam, and the measurement error
for a diameter of the polyester filament was about 8%.
5.6 Displacement and
Vibration Sensor for the Pipe
5.6.1 Introduction
In a nuclear plant,
safety considerations are paramount, since accidents in such a context affect
human life as well as the environment. In particular, the accidents of a
radioactive substance and sodium leakages should be avoided because they have a
strong influence on society even if they have no actual harm. One of the main
causes for the accidents is an abnormal mechanical behavior of a plumbing,
i.e., deformation, dislocation and vibration. In order to avoid accidents, many
detection and measuring systems have been developed and put to practical use,
in particular for the detection of abnormal mechanical behavior.16) These
systems have been classified to two; one is direct detection method, i.e.,
contact method, and another indirect method, i.e., non-contact method. Of
course, the indirect method is desirable as so far as it has approximately
equal detection capability and measurement accuracy as the contact method.
We have developed two
systems for monitoring the vibration of a transmission shaft for a drain pump17),
18) and for measuring the bearing wear19) of this shaft in
real time by means of an eddy current displacement sensor. The latter method
was described in Chapter 6.5 in detail. However both methods are not
non-contact methods in the usual sense since in these systems the sensors are
placed in close proximity to the target object. In these cases the sensor
systems must usually be dedicated to the particular target object and are not
interchangeable.
In this section, an
optical system has been developed for monitoring dislocation, deformation and
vibration from a point distant to the target object by means of a
retro-reflector.
5.6.2 Method and System
Figure
5.28 shows an optical arrangement of this system. A strong point of this method
is the use of small retro-reflectors, in other words, light returning
reflector, on some representative points on the vibrating target such as a
plumbing in a nuclear plant to detect a vibration of the plumbing as well as
its possible use in a manufacturing plant. The retro-reflectors are illuminated
with a white light and reflect the light to the illuminator. These reflectors
as the object are imaged on a CCD camera fixed far from the pipe, L, and in
close proximity to the illuminator. The imaging formulae are as follows:
|
|
(5.21) |
|
|
(5.22) |
Fig. 5.28 Optical arrangement of
this system.
where
M represents magnification factor, L'; the image distance between the imaging
lens and imaging plane of the CCD camera, f; the focal length of the camera, Di;
the vibration amplitude of the retro-reflector, and di; the
corresponding amplitude on the CCD camera. As an example, the vibration
amplitude of 1mm on the pipe, Di=1mm, will be 10![]() m on the camera, di=10
m on the camera, di=10 ![]() m, for L=5 m and f=50 mm. The amplitude of 10
m, for L=5 m and f=50 mm. The amplitude of 10![]() m can be easily detected by means of a commercial CCD camera
with a spatial resolution of 5
m can be easily detected by means of a commercial CCD camera
with a spatial resolution of 5![]() m, i.e., one pixel size of 5
m, i.e., one pixel size of 5![]() m
m![]() 5
5![]() m, which is sufficient for practical applications.
m, which is sufficient for practical applications.
Figure 5.29 represents a
block diagram of this system. The image data supplied by the CCD camera were
adapted for processing by a PC through the use of a image capture board. These
data were then processed and analyzed on a PC, which provided the information
regarding vibration. The CCD camera used in this experiment has a size of
4.88mm in width and 3.66mm in height, 640 lines in width and 480 lines in
height, 3.5![]() 105 pixels, and each pixel size of 7.4
105 pixels, and each pixel size of 7.4![]() m
m![]() 7.4
7.4![]() m.
m.
This method has, thus,
two merits for practical use. One is that the system can be used in a bright
room where sunlight and fluorescent light exist, since a retro-reflector
reflects light only to the light illuminator. The other is that all the
information on the plumbing's vibration can be represented by some
representative retro-reflectors fixed on the plumbing, thus reducing the amount
of data to be processed.
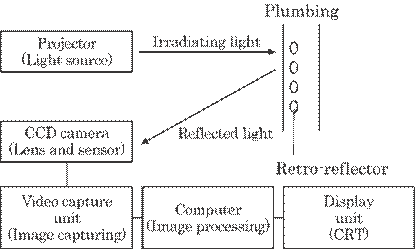
Fig.
5.29 Block diagram of the system.
5.6.3 Result and
Discussion
Preliminary experiment
has been carried out to make clear a spatial resolution of the vibration
amplitude, i.e., the smallest detectable displacement of the retro-reflector.
Figure 5.30 shows an experimental setup. The retro-reflector was positioned on
a plate, and the plate was moved in steps of 10![]() m by means of a micro-stage. The retro-reflector's shift of
10
m by means of a micro-stage. The retro-reflector's shift of
10
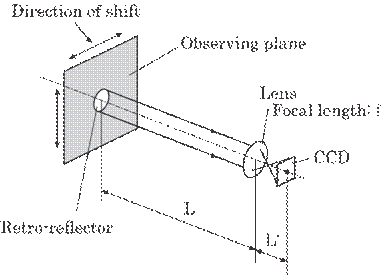
Fig. 5.30 Experimental setup.
mm,
D=10mm, was observed as a shift of 49 pixels on the CCD camera, i.e., 363(=49![]() 7.4)
7.4) ![]() m, for the optical construction of L=1430 mm and L'=51.8 mm.
The magnification factor obtained experimentally, Me, was Me=27.5
(=10.0/0.363), and that by Eq. (5.22), Mc, was Mc=27.6
(=1430/51.8). This agreement shows the validity of this method.
m, for the optical construction of L=1430 mm and L'=51.8 mm.
The magnification factor obtained experimentally, Me, was Me=27.5
(=10.0/0.363), and that by Eq. (5.22), Mc, was Mc=27.6
(=1430/51.8). This agreement shows the validity of this method.
In this preliminary
experiment, a vibration is, thus, simulated by a shift of the retro-reflector.
The frequency of the vibration is usually above a few tens Hz. In this case,
the image becomes dim on the CCD camera due to the vibration. Figure 5.31
expresses this fadeout. An area of this fadeout, df, can be
expressed by
|
|
(5.23) |
where
A expresses the vibration amplitude. Both integrals for the light intensity on
the CCD camera with and without the vibration are, of course, the same as the
constant total light amount in both cases.
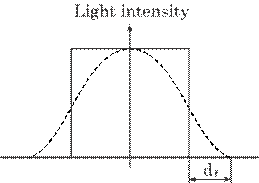
Fig. 5.31 Image fadeout due to vibration.
The spatial resolution, i.e.,
the smallest detectable vibration amplitude, is determined by the pixel size of
the CCD camera and the optical arrangement. It was found to be about 0.2
(=0.0074![]() 1430/51.8) mm for this experimental setup, i.e., pixel size
of 7.4
1430/51.8) mm for this experimental setup, i.e., pixel size
of 7.4![]() m, L=1430 mm, and L'=51.8 mm. The size of observing plane was
about 135 mm (=4.88
m, L=1430 mm, and L'=51.8 mm. The size of observing plane was
about 135 mm (=4.88![]() 1430/51.8) mm in width and 101 mm (=3.66
1430/51.8) mm in width and 101 mm (=3.66![]() 1430/51.8) in height in this experiment since the camera has
a size of 4.88 mm in width and 3.66 mm in height. It is, however, desired for
practical applications in a nuclear plant to image the retro-reflector at such
a distant place from it as L=10 m. In this case, the size of the observed plane
increases to about 942 mm (=4.88
1430/51.8) in height in this experiment since the camera has
a size of 4.88 mm in width and 3.66 mm in height. It is, however, desired for
practical applications in a nuclear plant to image the retro-reflector at such
a distant place from it as L=10 m. In this case, the size of the observed plane
increases to about 942 mm (=4.88![]() 10000/51.8) in width and 707 mm (=3.66
10000/51.8) in width and 707 mm (=3.66![]() 10000/51.8) in height, which is sufficient for this plant, if
the same camera is used. But the spatial resolution decreases to about 1.4
(=0.0074
10000/51.8) in height, which is sufficient for this plant, if
the same camera is used. But the spatial resolution decreases to about 1.4
(=0.0074![]() 10000/51.8) mm, which is not sufficient for such the
practical application as a nuclear plant. For higher spatial resolution, a CCD
camera with a smaller pixel size and a telescope imaging system with a long
focal length are required.
10000/51.8) mm, which is not sufficient for such the
practical application as a nuclear plant. For higher spatial resolution, a CCD
camera with a smaller pixel size and a telescope imaging system with a long
focal length are required.
The retro-reflector used
in this experiment was a circular disk of 15 mm in diameter, which was composed
of many micro-prisms; each has a size of about 0.3 mm![]() 0.3 mm. The reflector can always reflect light into around
the original light source; the directivity, i.e., light beam divergence, was
about 1/30. The reflexibility defined by the intensity ratio of reflected light
to that of incident light was roughly 37% at a normal reflection, i.e., 0
0.3 mm. The reflector can always reflect light into around
the original light source; the directivity, i.e., light beam divergence, was
about 1/30. The reflexibility defined by the intensity ratio of reflected light
to that of incident light was roughly 37% at a normal reflection, i.e., 0![]() inclination, and decreased to 97% at 10
inclination, and decreased to 97% at 10![]() inclination, 92% at 20
inclination, 92% at 20![]() inclination, and 65% at 30
inclination, and 65% at 30![]() inclination.
inclination.
In conclusions, the
following results were obtained.
(1)
The system consists of a sensor head including a white light source and some
retro-reflectors as an object, and a CCD camera as a light receiver, and a data
processing system including a computer and a display.
(2) A commercial CCD camera with a pixel size of
7.4![]() m
m![]() 7.4
7.4![]() m, 3.5
m, 3.5![]() 105 pixels, an imaging plane size of 4.88 mm
105 pixels, an imaging plane size of 4.88 mm![]() 3.6 mm, and a focal length of 51.8 mm is sufficient to obtain
a spatial resolution of 0.2 mm in an observed plane of 135 mm in width and 101
mm in height at a distance of 1.43 m.
3.6 mm, and a focal length of 51.8 mm is sufficient to obtain
a spatial resolution of 0.2 mm in an observed plane of 135 mm in width and 101
mm in height at a distance of 1.43 m.
(3)
The observed area becomes approximately 942 mm![]() 707 mm at a camera position of 10 m from the observing plane,
which is still reasonable for practical applications. However, the spatial resolution
decreases to 1.4 mm. In this case, a CCD camera with a higher spatial
resolution and a telescopic imaging system will be useful to obtain higher
spatial resolution.
707 mm at a camera position of 10 m from the observing plane,
which is still reasonable for practical applications. However, the spatial resolution
decreases to 1.4 mm. In this case, a CCD camera with a higher spatial
resolution and a telescopic imaging system will be useful to obtain higher
spatial resolution.
5.7 Cross-linking Sensor
for Enamel on a Copper Wire
5.7.1 Introduction
In the production of
electricity, the winding wire used to form the magnetic field, known as
magnetic wire, must be coated with an enamel layer in order to insulate the
electric current. The electrical property of this wire has mainly been
represented by the dielectric dissipation factor Tan![]() , which determines the electric power loss, and the physical
property has been represented by the glass-transition temperature Tg, which is
the temperature at which the solid state melts down to the liquid state. These
factors, Tan
, which determines the electric power loss, and the physical
property has been represented by the glass-transition temperature Tg, which is
the temperature at which the solid state melts down to the liquid state. These
factors, Tan![]() and Tg, are improved by cross-linking of the enamel layer,
which can be accomplished by heating the applied enamel at an appropriate
temperature for an appropriate amount of time. The degree of cross-linking
determines the properties of the wire, i.e., Tan
and Tg, are improved by cross-linking of the enamel layer,
which can be accomplished by heating the applied enamel at an appropriate
temperature for an appropriate amount of time. The degree of cross-linking
determines the properties of the wire, i.e., Tan![]() and Tg, and thus is one of the most important factors in
production control.
and Tg, and thus is one of the most important factors in
production control.
The dielectric
dissipation factor Tan![]() has usually been measured electrically by means of a
resonant circuit with an auxiliary capacitance.20) On the other
hand, the glass-transition temperature has been measured chemically.21)
These two methods are accurate, but too difficult and time-consuming for
industrial use. A simple, real-time method for these measurements is therefore
needed to control and improve the quality of the products.
has usually been measured electrically by means of a
resonant circuit with an auxiliary capacitance.20) On the other
hand, the glass-transition temperature has been measured chemically.21)
These two methods are accurate, but too difficult and time-consuming for
industrial use. A simple, real-time method for these measurements is therefore
needed to control and improve the quality of the products.
In this section, we
introduce an optical method for estimating the degree of cross-linking of an
enamel layer, i.e., the dielectric dissipation factor Tan![]() and glass-transition temperature Tg, by measuring the
reflected light intensity on the surface of an enameled wire.
and glass-transition temperature Tg, by measuring the
reflected light intensity on the surface of an enameled wire.
5.7.2 Principle and
Method
A wire with an enamel
layer is baked in a hearth at a temperature of 500![]() over 30 minutes and is then cross-linked to a proper degree.
The color of the enamel layer changes from light yellow to dark brown as the
degree of cross-linking increases. This color change is caused by a
deterioration in the layer due to heating, which produces the radicals of >C=O< and >C=C and increases the light absorption.22)
As a result of this color change of the enamel coated on a copper wire, the
degree of cross-linking can be estimated by simply measuring the reflected
light intensity. Thus, this method requires only a light power meter, and does
not require a colorimeter.
over 30 minutes and is then cross-linked to a proper degree.
The color of the enamel layer changes from light yellow to dark brown as the
degree of cross-linking increases. This color change is caused by a
deterioration in the layer due to heating, which produces the radicals of >C=O< and >C=C and increases the light absorption.22)
As a result of this color change of the enamel coated on a copper wire, the
degree of cross-linking can be estimated by simply measuring the reflected
light intensity. Thus, this method requires only a light power meter, and does
not require a colorimeter.
Figure 5.32 provides a
schematic of the measurement system. The system consists of three subsystems,
i.e., a light sensor head (![]() ),
a system for shifting the wire (
),
a system for shifting the wire (![]() ),
and a data-processing system (
),
and a data-processing system (![]() ).
Laser light from a semiconductor laser is focused on the enameled wire, and the
laser light reflected off the wire is focused on a photo-diode. The light
intensity on the photo-diode is amplified, A/D converted, processed, and
finally displayed. A semiconductor laser of wavelength of 650 nm was used as a
light source and a silicone photodiode as a light receiver.
).
Laser light from a semiconductor laser is focused on the enameled wire, and the
laser light reflected off the wire is focused on a photo-diode. The light
intensity on the photo-diode is amplified, A/D converted, processed, and
finally displayed. A semiconductor laser of wavelength of 650 nm was used as a
light source and a silicone photodiode as a light receiver.
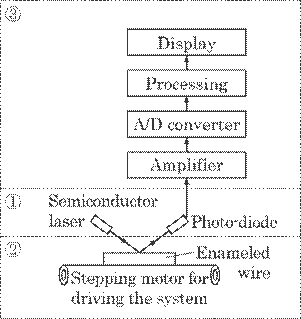
Fig. 5.32 Measurement system for the experiment.
The light intensity is
smoothed by averaging several values at different positions, and this smoothed
value is used as the final measured value. Each datum at a slightly different
position can be obtained at a frequency of about a few tens kHz, since this
method requires only light intensity for the measurement. One measuring value
can then be obtained at a frequency of a few kHz for ten times smoothing, which
means real-time measurement.
5.7.3 Results and
Discussions
A preliminary experiment
was carried out using the measurement system shown in Fig. 5.32. Figure 5.33
expresses the relation between the normalized light intensity, I/I0,
and inductive loss, Tan![]() . Each measured value was smoothed by means of ten data, and
was normalized by the reflected light intensity, I0, on the wire surface
without an enamel layer, i.e. a naked copper wire. Two kinds of data, i.e.,
Class 1 and Class 2, are shown in this figure: Class 1 has a somewhat thick
enamel layer between 22 and 60
. Each measured value was smoothed by means of ten data, and
was normalized by the reflected light intensity, I0, on the wire surface
without an enamel layer, i.e. a naked copper wire. Two kinds of data, i.e.,
Class 1 and Class 2, are shown in this figure: Class 1 has a somewhat thick
enamel layer between 22 and 60![]() m for a wire diameter between 0.5 and 3.2 mm, and Class 2 a
somewhat thin layer between 15~33
m for a wire diameter between 0.5 and 3.2 mm, and Class 2 a
somewhat thin layer between 15~33![]() m for the same wire diameter. This classification was given
by Japanese Industrial Standard, JIS.
m for the same wire diameter. This classification was given
by Japanese Industrial Standard, JIS.
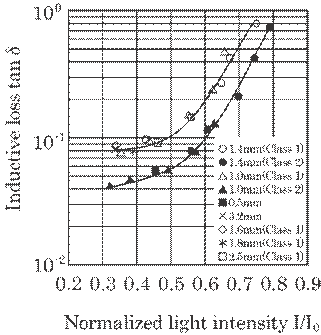
5.33 Relation between inductive loss Tan![]() and normalized light intensity I/Io.
and normalized light intensity I/Io.
The
relations between I/I0 and Tan![]() for both Class 1 and Class 2 data can be expressed as
follows from the least squares method.
for both Class 1 and Class 2 data can be expressed as
follows from the least squares method.
|
|
(5.24-1) |
|
|
(5.24-2) |
Thus,
the inductive loss Tan![]() can be definitively expressed by means of the normalized
light intensity, I/I0, and then can be roughly estimated from the
measured light intensity. That is, Eqs. (5.24-1) and (5.24-2) can be used as a
calibration curve to estimate inductive loss.
can be definitively expressed by means of the normalized
light intensity, I/I0, and then can be roughly estimated from the
measured light intensity. That is, Eqs. (5.24-1) and (5.24-2) can be used as a
calibration curve to estimate inductive loss.
Figure 5.34 expresses
the relation between the normalized light intensity, I/I0, and
transition temperature, Tg. In this case, two kinds of curves for Class 1 and
Class 2 separate each other just as in Fig. 5.33, and are expressed as follows.
|
|
(5.25-1) |
|
|
(5.25-2) |
The
transition temperature Tg can also be definitively expressed by means of the
normalized light intensity, I/I0, and then can be roughly estimated
by means of the measured light intensity.
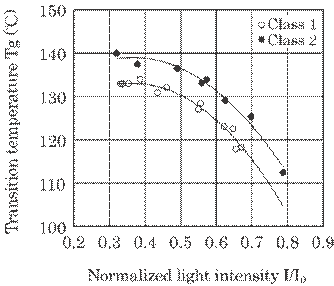
Fig. 5.34 Relation
between transition temperature Tg and normalized light intensity I/Io.
Both the light intensity
in Fig. 5.33 and that in Fig. 5.34 were normalized by I0, which was
the reflected light intensity from a naked copper wire as described above. When
an enamel layer is slightly cross-linked, the reflected light intensity I is
due mainly to the intensity of the light reflected from the naked copper wire;
this is especially true in the case of a wire with a thin enamel layer, since a
large part of the incident laser light transmits the layer in this case. Thus a
large normalized light intensity corresponds to a small degree of
cross-linking, and no cross-linking approaches I/I0=1. On the other
hand, when the enamel layer is largely cross-linked, the reflected light
intensity decreases largely, particularly in a thick layer, since a large part
of the incident laser light is absorbed in the layer, and thus a small value of
a normalized light intensity corresponds to a large degree of cross-linking.
Thus, the normalized light intensity expresses the degree of cross-linking, and
the two have a roughly inverse relationship. Strictly speaking, the same inductive
loss Tan![]() and the same transition temperature Tg can be obtained at
the same degree of cross-linking, in other words, at the same reflected light
intensity when the thickness is same. However, the intensity of the light
reflected from layers with the same degree of cross-linking will not be the
same if the thickness of the layers is not the same. The thickness of enamel
layer is thicker in Class 1 than that in Class 2 even if a radius of the wire
is same, and this leads to two types of curve for Class 1 and Class 2. The
normalized light intensity for the same inductive loss Tan
and the same transition temperature Tg can be obtained at
the same degree of cross-linking, in other words, at the same reflected light
intensity when the thickness is same. However, the intensity of the light
reflected from layers with the same degree of cross-linking will not be the
same if the thickness of the layers is not the same. The thickness of enamel
layer is thicker in Class 1 than that in Class 2 even if a radius of the wire
is same, and this leads to two types of curve for Class 1 and Class 2. The
normalized light intensity for the same inductive loss Tan![]() for Class 1 is smaller than that for Class 2, since more
incident laser light will be absorbed in the thick layer than in the thin layer.
In the same way, the normalized light intensity for the same transition
temperature Tg for Class 1 is smaller than that for Class 2.
for Class 1 is smaller than that for Class 2, since more
incident laser light will be absorbed in the thick layer than in the thin layer.
In the same way, the normalized light intensity for the same transition
temperature Tg for Class 1 is smaller than that for Class 2.
These results in Fig.
5.33 and Fig. 5.34 suggest a definitive relation between the inductive loss Tan![]() and transition temperature Tg. Figure 5.35 shows this
relation, which can be expressed as follows from the least squares method.
and transition temperature Tg. Figure 5.35 shows this
relation, which can be expressed as follows from the least squares method.
|
|
(5.26) |
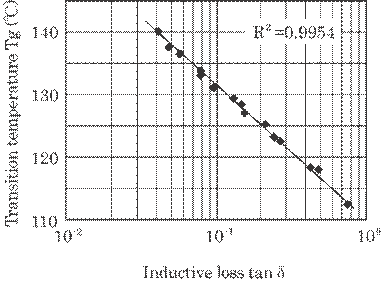
Fig. 5.35 Relation between inductive loss Tan![]() and transition temperature Tg.
and transition temperature Tg.
Here,
R2=0.9954 is a correlation coefficient of this straight line. This
result indicates the close relation between Tg and Tan![]() . Thus the transition temperature increases, and the
inductive loss decrease as a decrease of a normalized light intensity due to an
increase of a cross-linking.
. Thus the transition temperature increases, and the
inductive loss decrease as a decrease of a normalized light intensity due to an
increase of a cross-linking.
In conclusions, the
following results were obtained.
(1) The system consists of three subsystems,
i.e., a sensor head, a system for shifting the wire, and a data-processing system.
(2)
Both the inductive loss and the transition temperature can be estimated by
means of the reflected light intensity on the wire surface within an error of
5%. The system has been constructed and now is being used in a practical plant.
the wire surface within an error of 5%. The system has been constructed and now
is being used in a practical plant.
5.8 Surface Creases
Sensor for Polyethylene Sheets
5.8.1 Introduction
Polyethylene sheets have
been used mainly in batteries. The main functions of these sheets are to
insulate the electrode, impregnate sulfuric acid, and pass air bubbles during
the process of electrolysis. The ribs on the sheet act mainly as an insulator,
and the sheets' porosity acts as an impregnator and an air filter. Thus, a battery's
performance is determined mainly by the rib's and sheets' porosity. The degree
of porosity is determined by the amount of oils impregnated in the early state
of manufacturing, which is finally extracted resulting in porosity.
Ribs are formed by means
of a metal mold after the oil has been extracted. The size and separation of
the ribs are important factors in the performance of the battery. We have
reported an optical system for measuring these factors away from the
manufacturing line, i.e., in off-line.23) Polyethylene sheets with
widths of about 1m and a thickness of about 0.3mm have usually been
manufactured by means of an extruding machine at a considerably high speed of
about 1m/sec. In such high-speed manufacturing, crumbling, creasing, and the
deformation of ribs occur at times, resulting in inferior goods. This
constitutes a rather serious problem for a manufacturer.
Some optical methods
have been developed for inspecting the surface of industrial parts24)
and evaluating their surface roughness25). These methods using a
scattered light can, in a principle, be used for detecting creases in a
polyethylene sheet. However, they cannot be applied in our plant since they can
inspect and detect the surface only in off-line; whereas real-time detection is
required in a manufacturing plant.
In this section, an
optical system for detecting creases in polyethylene sheets in real time has
been developed.
5.8.2 Method and System
In our previous paper23),
transmitted light was used to measure the rib size and the separation between
them formed on the polyethylene sheet(see Chap. 4.5). However, in this study
scattered light is used to detect the creases in the sheet since creases
drastically alter the shape of scattered light.
Figure 5.36 shows some
samples of a polyethylene sheet containing creases. These are cut samples used
practically in batteries. A sheet of about 1m in width was produced at a
production speed of about 1m/s in a plant. Once these creases have developed in
a sheet, the flaw continues to be imposed on the sheet due to the high
production speed. A length of a crease is over 3 m, with a width of usually a
few mm. The purpose of this study is to develop
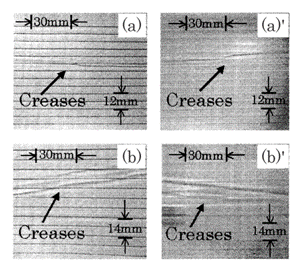
Fig. 5.36
Some samples of polyethylene sheets. (a) and (b); interior side with ribs,
and (a)' and (b)'; exterior side without ribs.
an
optical system for detecting these creases while the product is being
manufactured, i.e., in-line. As is shown, the creases appear on both sides of
the sheet, i.e., the interior side with the ribs (Figs. 5.36(a) and (b)) and on
the rough flat exterior side (Figs. 5.36(a)' and (b)'). Thus, the creases can
be detected by means of the scattered light directed onto the flat exterior
side since the scattered light on the interior side becomes rather noisy due to
the ribs. Both scattered and reflected lights can be used to detect the creases
as in the previous study.24) Scattered light was, however, used in
this paper from the following reasons. One is that reflected light was rather
noisy due to ribs than scattered light; reflected light changed largely on even
an undulated surface due to the ribs, resulting in a light noise. Another is
that an intensity change in scattered light due to creases, i.e., a signal, was
larger than that of reflected light. Thus, scattered light has a greater S/N
ratio than that of reflected light.
Figure 5.37 shows the
optics for the detection of creases. Laser light with a wavelength of 670 nm
from a semiconductor laser irradiates a polyethylene (PE) sheet vertically. A
sheet-like laser light of 1 mm ![]() 10 mm was irradiated on to the sheet parallel to the
production direction, i.e., lengthwise with the creases, to increase a change
of scattered light intensity due to creases, i.e., a signal. A long narrow
photodiode of 1.2 mm
10 mm was irradiated on to the sheet parallel to the
production direction, i.e., lengthwise with the creases, to increase a change
of scattered light intensity due to creases, i.e., a signal. A long narrow
photodiode of 1.2 mm![]() 15 mm was used according to the sheet-like laser light. A
part of the scattered light was received on this photodiode resulting in a
signal. The output of the receiver is linearly proportional to received light
intensities within a wide range of intensity. The light receiver was fixed at
about 8 mm from the irradiated portion and at a horizontal angle of about 20
degrees. These optical conditions including laser irradiation and the light
receiver were found to be the best choice
15 mm was used according to the sheet-like laser light. A
part of the scattered light was received on this photodiode resulting in a
signal. The output of the receiver is linearly proportional to received light
intensities within a wide range of intensity. The light receiver was fixed at
about 8 mm from the irradiated portion and at a horizontal angle of about 20
degrees. These optical conditions including laser irradiation and the light
receiver were found to be the best choice
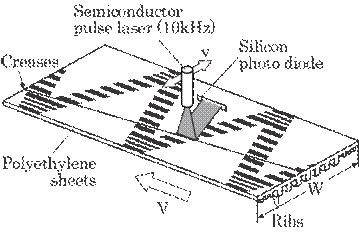
Fig. 5.37 Optics for the detection of creases.
as
based on experiments involving various irradiated sizes and forms, and
distances and angles of the receiver. The width of the sheet-like laser, 1mm in
this case, was about half of the smallest width of the creases. This condition
was similar to the optimum conclusion for detecting surface flaws determined in
the previous study.24) The laser traces a zigzag course on the
polyethylene sheets as shown in this figure since both the polyethylene sheets
and the laser move perpendicular to each other.
Figure 5.38 shows the
block diagram of the system. The amplifier with a band pass filter
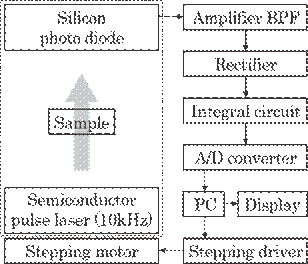
Fig. 5.38 Block diagram of the system.
amplifies
the output on the silicon photodiode and transmits only the output of a pulsed
laser to an A/D converter. An amplified analog signal from the amplifier is
converted to digital signal by means of an 8 bit A/D converter. The digitized
signal is, then, received on personal computer (PC), where the signal is processed
to detect and correct for creases. The PC also gives a warning signal for the
detection of creases and a driving signal for a stepping motor to move the
laser. The sampling frequency of the system f was f=1kHz.
5.8.3 Results and
Discussions
A preliminary experiment
was performed to determine the accuracy of the proposed method. Figure 5.39
shows the experimental setup used in this study. The laser was scanned
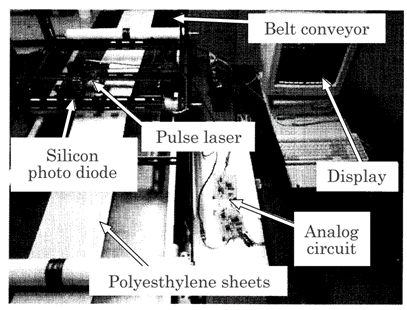
Fig.5.39 Experimental setup used in this study.
transversely
going and returning , i.e., direction of width (W), with a speed of
v(=0.05m/s). The speed of the PE sheet, V, was about 0.4m/s in this experiment.
The ratio of the scanning speed of the laser to the speed of the PE sheet, v/V,
should be chosen properly since an irradiated area traces a zigzag course on
the PE sheet as shown in Figure 5.37; short creases cannot be detected. To
detect all the creases with a length longer than L, the following relation is
required since L should be longer than VT, where T is the turn-around time of the
laser between the sheets, i.e., T=2W/v.
|
|
(5.27) |
In
a practical plant, almost all creases are longer than 3m. Thus a laser scanning
speed of (2/3) m/s is necessary for a production speed of V=1m/s and a PE sheet
width of W=1m.
Figure 5.40 shows an
example of the received signal. The large change is due to creases, which is
used as a signal. On the other hand, the small change is due to ribs on the
interior
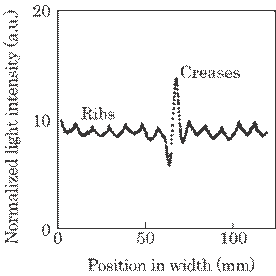
Fig. 5.40 Example of the
received signal. Each dot represents a mean value of 10 samples.
side,
which is a noise. Thus, the creases can be detected clearly at a glance since
the signal is greater by 5 times than the noise. That is, the latest
peak-to-peak value obtained at successive intervals, i.e., a new value, was
compared with the mean value over 100 peak-to-peak values just before a new
value; an alarm signal for creases was displayed when the new value was greater
by 2.5 times than the mean values. A value of 2.5 was a best choice for our
purpose; the accuracy of detection was above 95% for this value, and was lower
for other values of 2.5. That is, some creases were missed at greater values
than 2.5, and the excessive creases due to noise were over-detected for values
smaller than 2.5.
Each datum, i.e., the
dots in Figure 5.40, was a mean value of 10 samples, which decreased an abrupt
change of the light intensity of each sample mainly due to a surface condition
of the sheet. This means that the effective sampling frequency, F, is only
F=100(=f/10) Hz. The degree of this smoothing, n=10 in this experiment, should
be so chosen that an effective sampling should be performed on every crease
when a laser scans sheets with a velocity of v. This leads to the condition of,
![]() , for a width of
creases, w, since a period of effective sampling is 1/F. In this preliminary
experiment, the scanning speed of v=50 mm/s is small sufficiently compared to
the value of Fw = 200 mm/s for w=2mm. Creases were, then, detected clearly as
shown in this figure. Considering these two conditions for v given by Eq.
(5.27) and above relation,
, for a width of
creases, w, since a period of effective sampling is 1/F. In this preliminary
experiment, the scanning speed of v=50 mm/s is small sufficiently compared to
the value of Fw = 200 mm/s for w=2mm. Creases were, then, detected clearly as
shown in this figure. Considering these two conditions for v given by Eq.
(5.27) and above relation, ![]() , the following condition for the sampling frequency can be
given.
, the following condition for the sampling frequency can be
given.
|
|
(5.28) |
Thus,
an A/D converter with a sampling frequency of above 3.3 kHz is required for a
manufacturing plant with production conditions that include W=1m, V=1m/s, n=10,
L=3m, and w=2![]() 10-3m.
10-3m.
In conclusions, the
following results were obtained.
(1)
The sensor system consisted of a semiconductor laser and a line photodiode, a
signal processing system including an amplifier with a band pass filter, an A/D
converter, a personal computer, and an alarm.
(2)
The A/D converter with a sampling frequency of 4kHz was adequate for a plant
with production speed of 1m/s and sheets with widths of 1m.
(3)
The accuracy of this system for creases of longer than 3m and greater than 2mm
in width was above 95%.
References
12) M. Ueda, M. Kawazu, J. Chen, K. Taniguchi, K.
Asada, & H. Suga, Cloth weft densitometer using a CCD camera. Rev Laser
Eng. 26-2(1998) p. 161.
13) J. Chen, Y-E Lee, K. Taniguchi, K. Asada,
& M. Ueda, Optical method for measuring mean diameter of glass wool fibers.
Rev Laser Eng. 26-2(1998) p.176.
14) J. Chen, Y-E Lee, M. Ueda, K. Taniguchi,
& K. Asada, A simple optical method for the
measurement of glass
wool fiber diameter. Opt Lasers
15) J. D. Jr Ingle, S. R. Crouch, Spectrochemical
Analysis, Prentice Hall,
16) Ed. M. Hori: Fundamentals of Fast Reactor
Engineering (NIKKAN KOGYO SHINBUN, Tokyo, 1993) p. 185.
17) T. Yamaguchi, Y. Iwai, S. Inagaki, & M.
Ueda: Vibration monitoring system for a transmission shaft in real time using
an eddy current displacement sensor, Tran. Soc. Instrum. Contr.
18) T. Yamaguchi, Y. Iwai, S. Inagaki, & M.
Ueda: A method for detecting bearing wear in a drain pump utilizing an
eddy-current displacement sensor, Meas. 33(2003) p. 205.
19) Y. Yamaguchi, & M. Ueda: An active sensor
for monitoring bearing wear by means of an eddy current displacement sensor,
Meas. Sci. Technol. 18(2007) p. 311.
20) International Electro-technical Commission,
IEC Standard: Publication 251-1, Second Edition, "Method for testing
winding wires, Part 1, Enameled wires", Gene've, Suisse (1978) p. 47.
21) S. Okamura, A. Nakajima, S. Onogi, H. Kawai,
Y. Nishijima, T. Higashimura, and N. Ise, Introduction to Polymer Chemistry,
Second Edition, Kagaku Dojin, (1992) p. 168.
22) Y. Takezawa, and J. Katagiri, Elec. Machinery
and Appliances, 9(2002) p. 26.
23) F. Murase, M. Ueda, K. Asada, T. Matsumoto,
& K. Ishikawa: Optical system for measuring a rib of polyethylene sheet,
Rev. Laser Engr. 28(2000) p. 769.
24) J. Chen, T. Yamaguchi, K. Tanigutchi, K.
Asada, & M. Ueda: A laser system for detecting flaws of a molding, Rev.
Laser Engr. 26(1998) p. 744.
25) J. Chen, Q. Zhang, K. Taniguchi, K. Asada,
& M. Ueda: An optical measuring system for the surface roughness of glass
wool papers, Int. Laser Sen. Symp. (1999) p. 2.
[Chapter 6
will be presented in the upcoming November-December 2010 issue of this Journal.]
[ BWW Society Home Page ]
© 2010 The Bibliotheque: World Wide Society