|
(a) |
(b) |
|
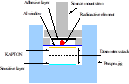
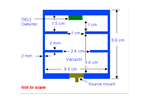
Figure 1: (a) Schematic diagram of irradiation setup for LiF and CaSO4:Dy dosemeters using a 60Co model hot particle inside a perspex jig. (b) Cross section view of the experimental setup of the 60Co model hot particle used for electron spectra measurements. The Si(Li) detector diameter is 1.8 cm. |
|
Thermoluminescence Imaging Photon Detector (IPD)
The IPD system at the University of Oxford allows the measurement of the thermoluminescence (TL) emitted by phosphors to be imaged with a spatial resolution of ~33µm. The IPD was first used by Smith et al.(21) and Wheeler (22). Detailed information about the operation of the IPD can be found in these two sources. The system consists of a micro-channel plate detector device (MCP), optics necessary to focus the image on the photo-cathode, a TL heater glow oven and a computer for image acquisition. The construction of the MCP enables the determination of the coordinates of the position where a photon hits the photo-cathode. In practice the dynamic range on the Oxford reader is presently limited by a 106 total count restriction for the whole image. Therefore, if the sample is very bright, then neutral density filters must be used to attenuate the emitted light. In the present work, the heating rate of the heating strip (1°C s-1) and the read-out temperature range were set manually on the temperature controlling unit.
For the dose measurements, two types of novel ultra thin TL phosphors were used, LiF and CaSO4:Dy powder deposited on Kapton film. The films were manufactured by and obtained from CORAD (Montpellier, France) using ultra fine powder which we separated from bulk using a sedimentation technique. The sensitive phosphor layer thickness is 3.6 mg cm-2 for LiF and 6.1 mg cm-2 for CaSO4:Dy dosemeters. The backing thickness for both dosemeters is 7.6 mg cm-2 of Kapton tape. The heating and the acquisition of the image are operated independently so the acquisition of the image can be started at any chosen temperature. This means that the image from any given temperature range (e.g. a specific TL glow curve peak region) can be acquired. The acquired image can be displayed on the computer screen and quantitative measurements can be obtained by integrating chosen regions of interest. The glow curve for any region of interest can be examined and the image for a restricted temperature region can be viewed. The data can also be exported in different formats, thus allowing automated analysis of the image. For the IPD data acquisition, we have used a software package (RADDS) for the evaluation of radial dose distributions and for the calculation of doses averaged over specific areas around the hot particle source. Radial Dose Distribution Software (RADDS) used was developed originally for the analysis of hot particle images in radiochromic dye film using a scanning microdensitometer. In the IPD system the calculated resolution of the image is ~33µm/pixel. This was determined by imaging a novel thin (100 µm thick) clear fused quartz (CFQ) dosemeter of a known length and measuring the corresponding number of pixels on the image. Two groups, 30 dosemeters each, of LiF and CaSO4:Dy were used to study the reproducibility, glow curve shape, fading and annealing behaviour.
The Monte Carlo EGSnrc Code System
The EGS4, Electron Gamma Shower code (version 4), code is a general purpose Monte Carlo (MC) code system that simulate coupled transport of electrons and photons with energies of several TeV down to several KeV(24). The Parameter Reduced Electron Step Transport Algorithm, PRESTA-I, was used in the simulations to avoid step size artefacts(25) of low energy electrons. In EGSnrc a completely new electron transport algorithm is used which removes all known shortcomings of the EGS4/PRESTA-I algorithm(28) .
In the present work, the experimental set-up of the source and target details (Fig 1) has been exactly simulated. The spherical 60Co hot particle source was modeled as a surface loop and the positions and directions of created particles were randomized and normalized isotropically in all directions. A direct method was used for the energy sampling in which the particle energy is represented as a function of the normalized cumulative probability distribution of the 60Co theoretical spectrum. Two different user codes were written to simulate the experimental set-up, one for beta spectrua and the other for the absorbed dose. The default $CALL_HOWNEAR macro required by PRESTA-I was overwritten to match our complicated geometry of the actual experiments. Step size ESTEPE of 1% with the default PRESTA-I were used. Each electron was followed down to a cut-off energy (0.512 MeV) which includes both the electron rest mass energy (0.511 MeV) and its kinetic energy. Data for stopping power were created using ICRU 37(26). The calculations of beta spectra were carried out for the sake of comparison with the beta spectra from the 60Co hot particle measured at the Nuclear Physics Department of The University of Oxford and for testing the sampling technique used inside the SHOWER loop. The beta and gamma radiation components of the absorbed dose were simulated separately and then added to obtain the total absorbed dose for comparison with the measured one.
RESULTS AND DISCUSSIONS
IPD Measurements
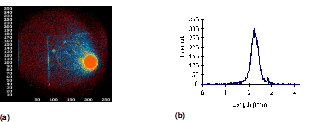
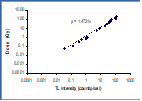
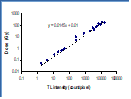
The sensitivity of CaSO4:Dy among different dosemeters within the batch is good (< ±4%). The individual dosemeter cannot however be used for multiple successive dose measurements because the necessary high annealing temperature (420 oC) damages these dosemeters. In contrast, the sensitivity of each LiF dosemeter vary within a factor of three. However, individual LiF dosemeters could be annealed at only 300 oC to give a good individual reproducibility (~ ±3%) for successive use. Therefore, in the present work, it was decided to use CaSO4:Dy dosemeters only once and to use them in batches of 12. LiF dosemeters were used individually, with individual calibration. All the measurements were carried out at 6 hours after irradiation to allow for the rapid fading of low temperature TL peaks. The read-out temperature ranges were chosen to be 150-250 oC for LiF and 170-300 oC for CaSO4:Dy to encompass the main glow peaks. Fig 2a shows a typical IPD image for clear fused quartz CFQ sample only for the sake of demonstration. Fig 2b is the radial dose distribution across the whole image. For the calibration, groups of 25 dosemeters from each batch were irradiated, in terms of absorbed dose in tissue, with a teletherapy 60Co gamma radiation source at the Research Institute, Churchill Hospital, Oxford. The dose rate of the source, as measured ionometrically using a 0.6 cm-3 graphite ionisation chamber calibrated at the National Physical Laboratory (NPL), was 1.056 Gy/min. Figs 2c and 2d shows the calibration curves of LiF and CaSO4:Dy dosemeters, respectively. The minimum detectable dose (corresponding to 1 count per pixel) for the IPD system in the current configuration is about 1.0 Gy for LiF and 0.04 Gy for CaSO4:Dy. A stack of dosemeters was irradiated using the 60Co hot particle in the perspex jig as shown in Fig 1.
|
|
|
|
(c) |
(d) |
|
Figure 2: (a) A typical image obtained after a 15-minute exposure of a CFQ sample where the dimensions are represented in pixels (1 mm = 30 pixels). The bright area produced by the irradiation with hot particle is clearly visible. (b) dose distributions across the image. (c) calibration curve of LiF. (d) calibration curve of CaSO4:Dy. TL intensity was integrated over the temperature range 150-250 oC. |
|
Fitting results from these calibration curves along with the IPD images were analysed using a specially developed Radius Dose Distribution Software (RADDS) to obtain the dose distributions around the hot particle.
EGS Calculations
Table (1) shows the calculated integrated beta spectra for 60Co by using MCNP, EGS4, EGSnrc and the Si(Li) measured spectrum. This represent the electron flux emitted from the surface of the hot particle. The standard errors are for 20 million histories for MCNP, 30 million for EGS4 and 150 million for EGSnrc. The measurements of the spectra have a systematic uncertainty in the source activity (4%) and in the source-detector solid angle (2%). Other possible source of systematic errors arise from the correction for Compton electrons produced in the 5mm aluminum absorber and from the possibility of small deviations in the location of the source from run to run. Such effects should be no greater than the statistical errors. The EGS4 results seem to agree well with the MCNP emulated version of the Integrated Tiger Series (ITS) where both codes are originally targeting the electron simulation. The results from both codes underestimate the spectra for about 11% compared to the measurements. On the other hand, the results using the default version of MCNP(4B) agree consistently with the measurements, while that using the earlier verison MCNP(4A) overestimate the spectrum by about 10%. Overall, both the EGS4 and MCNP Monte Carlo codes give a good agreement (±10%) with the measurements. Therefore, this benchmark study provides a good basis for applying the EGS4 PRESTA-I and apparently better EGSnrc for further investigation of 60Co model hot particle regarding the estimation of spatial and depth dose distributions.
Table 1: Measured and calculated integrated beta spectrum for 60Co model hot particle source (COVI) using the experimental setup shown in Fig 1. Values given are number of electrons per disintegration.
|
MeasuredValue |
MCNP |
EGS4 |
EGSnrc |
|||
|
4A (Default) |
4B (Default) |
ITS (Default) |
ESTEPE (Default) |
ESTEPE (0.001) |
Default PRESTA |
|
|
3.31E-04 (±5%) |
3.59E-04 (±1.2%) |
3.36E-04 (±1.1%) |
2.93E-04 (±0.95%) |
3.00E-04 (±0.92%) |
2.99E-04 (±0.91%) |
3.20-04 (±0.61%) |
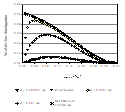
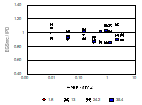
Fig 3a shows the beta spectrum emitted from 60Co hot particles of different diameters using EGS4 and EGSnrc. The figure includes the cases of the model hot particle and point source emulation that gives a good agreement with the theoretical 60Co Spectrum. This good agreement gives an indication that the sampling technique in particular, and that the EGS4 and EGSnrc Codes in general, are working efficiently. Fig 3b shows a comparison between the measured and calculated spectrum on the basis of experimental set-up.
|
|
|
|
(a) |
(b) |
|
Figure 3: (a) calculated beta spectra emitted from a 60Co source sphere with different sizes using EGS4. (b) comparison between measured and calculated (ESTEPE=0.001 and PRESTA-I=Default) spectra for 60Co model hot particle. The figure also shows the new EGSnrc calculations. |
|
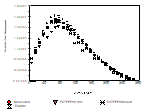
There is some fluctuation in the energy bins for the calculated spectrum but in terms of overall integration there was a ~11% under estimation was found for the EGS4 calculation compared with both the measurements and EGSnrc which is more efficient with under estimation of only 5%. ( Villarreal et al found 10% under estimation with MCNP4B+ITS, 11% over estimation with MCNP4A and 1% over estimation with MCNP4B.
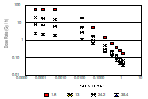
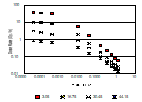
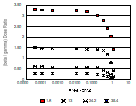
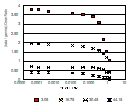
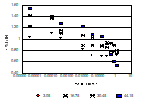
Figs 4a and 4b show the spatially calculated dose distributions at different depths for LiF and CaSO4:Dy dosemeters, respectively. The doses are the summation of beta and gamma components emitted from the model 60Co hot particle.
Figs 4c and 4d show the calculated beta/gamma ratio of spatial and depth dose distributions around 60Co model hot particle for LiF and CaSO4:Dy dosemeters, respectively.
|
(a) |
(b) |
|
|
|
|
Figure 4: Calculated spatial dose distributions around 60Co model hot particle at different depths depths using (a) LiF and (b) CaSO4:Dy. Numbers in the legend are depths in mg cm-2. The calculation were made using EGSnrc. Figs (c) and (d) shows the calculated beta/gamma ratio of spatial and depth dose distributions around 60Co model hot particle for LiF and CaSO4:Dy dosemeters, respectively. |
|
Dose Calculations Against Measurements
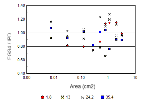
Direct comparisons between EGS4/EGSnrc calculations and IPD measurements of the dose distributions around 60Co model hot particle were done for LiF and CaSO4:Dy dosemeters. These comparisons are shown in Fig 5 for the two different dosemeters.
|
(a) |
|
|
|
|
|
Figure 5: Comparisons between dose calculations [(a) EGS4 and (b) EGSnrc] and measurements [IPD] for LiF while (c) and (d) are for CaSO4:Dy. Numbers in the legend are depths in mg cm-2. |
|
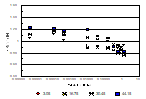
For LiF the agreement is good for small areas for all investigated depths. The LiF dosemeters (3.6 mg cm-2) are thinner and ~26 times less sensitive than CaSO4:Dy (6.1 mg cm-2) so poor count rate statistics at large area and higher depths are to be expected. The poor count rate statistics due to beta particles is compensated by a significant gamma component in the case of 60Co. This gamma component represents more than 50% of the total dose at large areas and higher depths. An independent investigation of the optical system, using a uniform irradiation from a large area 90Sr beta source, showed a 35% gradual decrease, in the radial direction across the field of view, in the intensity of the detected light by the imaging detector. Correction for this factor was not possible with the current setup of the IPD system since it is not possible to reproducibly position the sample at the center of the field of view. For CaSO4:Dy, the results are different from that of LiF. Because CaSO4:Dy dosemeters are thicker and more sensitive, the effect of poor count rate statistics at large area is not observed. The trend in the dose curves represents an overestimation of EGS4 calculated doses at small areas and underestimation of dose at large areas. This is similar to that previously obtained when the Monte Carlo MCNP was used to estimate the dose distributions around the same 60Co model hot particle. Furthermore, the homogeneity of CaSO4:Dy powder is not as good as for LiF and this is probably the cause of the dose overestimation at small areas. Overall, for LiF at shallow depths (1.8 and 13 mg cm-2), the ratio EGS4/IPD varies between 1.05 and 0.85 for small (<10-6 cm2) and large (1.0 cm2) areas, respectively. For measurements at greater depths (24.2 & 35.4 mg cm-2) the ratio EGS4/IPD is between 1.1 and 0.7. For CaSO4:Dy, there are similar trends in the ratio EGS/IPD but with slightly larger differences. For example, near the surface (3.05 mg cm-2) the ratio EGS/IPD varies from 1.0 to 0.8. At a depth of 44.15 mg cm-2 the ratio varies between 1.55 and 0.6. In the case of routine skin dosimetry in radiological protection, the relevant dose evaluation is over an area of 1 cm2 at a depth of 7 mg cm-2. For this particular case, the ratio EGS/IPD is ~ 1.0 for LiF and ~0.8 for CaSO4:Dy. This figure is similar to the MCNP/GAF ratio(2).
CONCLUSION
Spatial and depth dose distributions around a cobalt 60Co model hot particle were measured using the imaging photon detector (IPD) and ultra thin LiF and CaSO4:Dy TL dosemeters. Dose distributions due to gamma radiation and beta particles emitted by a 60Co model hot particle and its beta particle spectra were calculated using the Monte Carlo electron gamma shower EGS4 and EGSnrc codes. The integrated beta spectrum for the two different PRESTA-I inputs is approximately the same, which in both cases represents an underestimate of about 11% compared with the measured value. The new EGSnrc underestimate the spectrum with only ~6%.
Ultra thin LiF (3.6 mg cm-2) and CaSO4:Dy (6.1 mg cm-2) compared to RDF have greater sensitivity, shorter exposure times, lower minimum detectable dose. For practical routine radiological protection it is necessary to evaluate the skin dose as an average over an area of 1 cm2 at a depth of 70 μm. In this case EGS and IPD measurements using LiF dosemeters agree to within ~ ± 5%. IPD measurements using CaSO4 are about 20% less than calculations. There is no absolute standard for hot particle dose measurements or calculations. The extrapolation chamber, which is used as a standard measurement techniques for large area beta source dosimetry, cannot be used as a definitive primary standard for hot particles because of the highly non-uniform exposure, which precludes the use of the Bragg-Gray relationship. Measurements have now been carried out on 60Co test hot particle sources using extrapolation chamber (with corrections for non-linearity) radiochromic dye film, and LiF and CaSO4 thermoluminescence dosimetry (IPD). Calculations have been made using EGS (PRESTA) MCNP4A, MCNP4B, and MCNP4A+ITS. The default setting for each Monte carlo code appears to give the best results, when evaluated in terms of calculated and measured beta spectra emitted from the hot particle. MCNP4B predicts the beta spectrum to within 1%. The other codes to within 10%. Agreement decreases with depth for all codes. Comparison between measurements and calculations over the whole range of areas and depths measured in various studies do not fit any systematic pattern. In broad terms the agreement is within ~ ± 25% over a wide range of areas and depths. Agreement decreases with depth for all codes. Comparison between measurements and calculations over the whole range of areas and depths measured in various studies do not fit any systematic pattern.
Using EGS4, there was a trend in the curves describing this agreement represented by an over estimation of calculated dose compared with measured dose at small area and an under estimation of calculated compared to measured dose at large areas. This behaviour is similar to that previously obtained when the Monte Carlo MCNP was used to estimate the dose distributions around the same 60Co model hot particle. However, with better platform, fast computing, we could run much more histories and the trend seems to disappear. So, the trend was obviously due to a lack of enough histories. In conclusion, both techniques have been successfully applied to evaluate dose distributions around hot particles. For the EGSnrcMP simulation, the results are much better than the EGS4 ones. For the ICRP/ICRU recommended skin dose, at a depth of 0.07 mm (7 mg cm-2) averaged over an area of 1 cm2, the calculated to measured integrated dose ratio using EGSnrcMP is about 1.0±0.03 for both CaSO4 and LiF, respectively.
References
[1] Charles, M. W. The Hot Particle Problem Radiat. Prot. Dosim. 39, 39-47 (1991).
[2] Darley, P. J., M. W. Charles, I. E. Othman, A. S. Al-Aydarous and A. J. Mill (2000). “Origins and dosimetry of ‘hot particles' from nuclear plant operation.” Radiat. Prot. Dosim. 92(1-3): 131-137.
[3] COMARE (Committee on Medical Aspects of Radiation in the Environment), 1995. Potential Health Effects and Possible Sources of Radioactive Particles Found in the Vicinity of the Dounreay Nuclear Establishment
[4] COMARE (Committee on Medical Aspects of Radiation in the Environment), 1999. Sixth Report: A reconsideration of the possible health implications of the radioactive particles found in the general environment around the Dounreay Nuclear Establishment in the light of the work undertaken since 1995 to locate their source. Produced by the National Radiological Protection Board (NRPB).
[5] James, D. W. Problem Assessment of Discrete Radioactive Particles Elect. Pow. Res. Inst. Palo Alto,California : Report-NP-5969 (1988).
[6] Rogers, V. C. and Vance, J. N. Below Regulatory Concern Owner's Group: Assessment of Discrete Radioactive Particle Dose: Final Report Elect. Pow. Res. Inst. Palo Alto,California : Report-NP-5678 (1989).
[7] Kelly, J. J. and Gustafson, S. Industry Experience with Discrete Radioactive Particles Elect. Pow. Res. Inst. Palo Alto,California : Report-TR-104125 (1994).
[8] Mandjukov, I. G., Mandjukova, B. V., Alexiev, A. and Andreev, T. High Activity Hot Particles in Kozloduy Nuclear Power Plant - Status of the Investigations Radiat. Prot. Dosim. 54 133-138 (1994).
[9] Sula, M. J. Radiological Survey of Exposed Shoreline and Island of the Columbia River Between Vernita and the Snake River Confluence Nat. Tech. Info. Serv. Washington Report-PNL-3127 (1980).
[10] Balashazy, I., Feher, I., Szabadyne-Szende, G., Lorinc, M., Zombori, P. and Pogany, L. Examination of Hot Particles Collected in Budapest Following the Chernobyl Accident Radiat. Prot. Dosim. 22 263-267 (1988).
[11] Hoffman, W. and Crawford-Brown, D. J. The Radiological Significance of Beta Emitting Hot Particles from the Chernobyl Nuclear Power Plant (Letter) Radiat. Prot. Dosim. 28 309 (1989).
[12] Hoffman, W., Crawford-Brown, D. J. and Martonen, T. B. The Radiological Significance of Beta Emitting Hot Particles from the Chernobyl Nuclear Power Plant Radiat. Prot. Dosim. 22 149-157 (1988).
[13] Lancsarics, G., Feher, I., Sagi, L. and Palfalvi, J. Transuranium Elements in the Hot Particles Emitted During the Chernobyl Accident. Radiat. Prot. Dosim. 22 111-113 (1988).
[14] Osuch, S., Dabrowska, M., Jaracz, P., Kaczanowski, J., Van Khoi, L., Mirowski, s., Piasecki, E., Szeflinski, Z., Tropilo, J., Wilhelmi, Z., Jastrzebski, J. and Pienkowski, L. Isotopic Composition of High Activity Particles Released in the Chernobyl Accident. Health Phys. 57 707-716 (1989).
[15] Scott, B. R. The Radiological Significance of Beta Emitting Hot Particles from the Chernobyl Nuclear Power Plant (Letter). Radiat. Prot. Dosim. 27 125-126 (1989).
[16] Darley, P. J., Charles, M. W. Hart, C. D., Wells, J. and Coleby, M. S. E. Dosimetry of Planar and Punctiform Beta Sources using an Automated Extrapolation Chamber and Radiochromic Dye Films. Radiat. Prot. Dosim. 39 61-66 (1991).
[17] Soares, C. G., Darley, P. J., Charles, M. W. and Baum, J. W. Hot Particle Dosimetry using Extrapolation Chamber and Radiochromic Foils. Radiation Prot.ection Dosimetry 39 55-59 (1991).
[18] Othman, I. E. Development of Methods for Measuring and Calculating Spatial Dose Distributions around Hot Particles. Ph D Thesis, School of Physics and Astronomy, The University of Birmingham (2001).
[19] Darley, P. J., Charles, M. W. and Hart, C. D. Validation of Theoretical Models for Calculating Doses from Hot Particles. IRPA 153-156 (1994).
[20] Villarreal-Barajas, J. E., Charles, M. W. and Darley, P. J. “Compartive measurements of Co "hot paticle" depth dose distributions and Monte Carlo calculations.” Radiation Protection Dosimetry 854(1-4): 507-512(1999).
[21] Othman, I. E. and Charles, M. W. Thermoluminescence Properties of Novel Thin Clear Fused Quartz (CFQ) Dosemeters. Radiat. Prot. Dosim. 84(1-4), 193-199 (1999).
[22] Smith, B. W., Wheeler, G. C. W. S., Rhodes, E. J. and Spooner, N. A. Luminescence Dating of Zircon using an Imaging Photon Detector. Nucl. Tracks Radiat. Meas. 19, 273-278 (1991).
[23] Wheeler, G. C. W. S. Luminescence Studies Relevant to Archaeological Dating. Unpub. D. Phil. Thesis, The University of Oxford (1990).
[24] Nelson, W. R., Hirayama, H. and Rogers, D. W. O. The EGS4 Code System. SLAC-Report-265 (1985).
A Note on Membership in the BWW Society-Institute for Positive Global Solutions: Standard Membership requires an academic level of at least Associate Professor (or the equivalent in non-academic fields); Fellowship Status is reserved for Full Professors or equivalent.