Fundamentals and Practices of Sensing Technologies
by Dr.
Keiji Taniguchi, Hon. Professor of
Xi’ an
Dr. Masahiro Ueda, Honorary
Professor, Faculty of Education and Regional Studies
Dr. Ningfeng Zeng, an
Engineer of Sysmex Corporation
(A Global Medical
Instrument Corporation),
Dr. Kazuhiko Ishikawa,
Assistant Professor
Faculty of Education and
Regional Studies,
[Editor’s
Note: This paper is presented as Part VIII of a series from the new book
“Fundamentals and Practices of Sensing Technologies”; subsequent chapters will
be featured in upcoming issues of this Journal.]
Chapter Four
Abstract for Chap. 4
Many measurement
technologies by means of the light have been developed and used practically for
many manufacturing industries. The principles of these technologies are very
simple usually, which are based basically on a light attenuation due to
absorption in the material and a light reflection due to scattering on the
surface. Another principle is based on an interference of the laser light,
which is successfully applied for a thickness measurement of the thin film and
coating.
The practical application
technologies using light attenuation were described in chapter 4, and those
using light reflection were described in chapter 5. These technologies were all
the results of our joint research works with many corporations.
The measuring technologies
using light have, generally, many advantages as follows.
(1) The
real-time measurement and monitoring can be realized because of the extremely
high propagation velocity (![]() m/s).
m/s).
(2) The
nondestructive measurement and detection can be realized since many light
receiving elements with very high sensitivity are now in the market.
(3) The
point measurement can be realized because the light can easily be focused into
the very small area.
(4)
The measurement without electro-magnetic noise can be realized.
(5) The
measurement at a far distance, i.e., the remote sensing technology, can be
realized, which is used successfully in many industrial plants such as a
nuclear power plant, for an example.
(6)
Optical path can easily be controlled by means of an optical fiber.
These advantages results
in the followings in the practical plants.
(i) The
measurements, which were hitherto done manually, can be replaced by these
technologies, that is, these makes a reduction of labor.
(ii
) The technologies make high quality manufacturing.
(iii)
The technologies economize the resources.
In this chapter, the
purposes, the principles, the methods and results of these technologies are
described. That is, a blood leakage sensor is described in 4.1, a dye color sensor
in 4.2, a thickness sensor for polyethylene foam sheet in 4.3, a weight density
sensor for row glass wool in 4.4, a rib form sensor for polyethylene sheet in
4.5, and a weight density sensor for glass wool pipe in 4.6.
4.1 Blood Leakage Sensor
4.1.1 Introduction
Recently, high
sensitivities are needed more and more in the field of medical electronics. One
typical application is a blood leak sensing system used in an artificial
dialyzer. A number of sensors such as a temperature sensor, flow rate sensor,
pressure sensor, negative pressure sensor and bubble sensor are used as well as
a blood leakage sensor in an artificial dialyzer. A number of dialyzing
treatments are normally needed in any one week for a patient suffering from a
kidney disorder, and therefore a blood leak could potentially cause fatal
damage, even if leakage in each dialyzing treatment is a very small amount. For
this reason numerous research projects have focused on a blood leak sensor1).
Most instruments used to
detect blood are based on an optical non-intrusive method using an infrared ray
or a visible ray from a semi-conductor laser or a diode. In the systems
presently used for the dialyzing treatment, an alarm is triggered only when
blood concentration exceeds a pre-set threshold level, and even then no
quantitative data of the total amount of blood leakage is provided.
Furthermore, patient's life is in danger during the treatment since the
sensitivity of the sensor in current use is too low to detect a minor leakage.
A patient can be released from the danger if a highly sensitive blood leak
sensor is developed which gives a linear sensitivity with concentration in real
time.
The main principle of
the present method is based on the light attenuation theory. Laser light is
attenuated by the presence of blood cells in the optical path in a container,
and thus the measurement of the light attenuation gives the concentration of
blood. The sensitivity and the accuracy may then depend on the sensitivity and
the stability of the intensity measurement system, and on the fluctuations of
the incident light, respectively. The sensitivity for blood detection of
present ranges between 0.01 and 0.001 in weight %2)(weight ratio of
blood to solution), which is too small for recent medical appliances.
The purpose of this
study is to propose a simple method for the improvement of both the sensitivity
and stability of blood concentration measurement, without using complicated
equipment to stabilize the laser output, and to describe the construction of a
practical sensor system.
4.1.2 Principles and Methods
Light intensity
decreases by absorption or scattering when it propagates in a non-transparent
medium. We can then determine the concentration or density of the medium by
measuring the light attenuation. Since the intensity decreases in proportion to
an optical path length through the medium (if the medium is homogeneous), the
path length is extended by the multi-reflection technique, using a pair of side
mirrors mounted on the test cell in order to enhance the sensitivity. The
present technique is effective for a higher sensitivity, however the use of a
narrow-beamed laser is necessary to avoid an over-enlarging beam size at the
exit of the cell.
Figure 4.1 shows an
experimental setup. Laser light from a semi-conductor laser is divided into two
beams by a beam splitter, one is a reflected beam and the other a transmitted
beam.
Fig. 4.1 Experimental setup of the sensor. (Numerical
values in this figure are in mm ).
The
reflected beam directly enters a light power meter S1 and its power
is measured to provide the incident laser light level and is used for the
normalization of the attenuated light. The transmitted beam enters a cell in
which a test subject is filled and is led to a light power meter S2
after the multi-reflection on a pair of side mirrors inside the cell. The
attenuated power is measured by the meter S2 and is divided by the
power of the incident light given by S1. This normalization
automatically eliminates errors due to the unknown fluctuations in the
intensity of the incident beam. The multi-reflection extends the optical path
length and thereby increases the sensitivity. A semi-conductor laser with a
wavelength of 680nm has been chosen because it is reasonably priced and is easily
available for practical use. A physiological salt solution mixed with blood was
used as a test subject in order to evaluate the system sensitivity and
stability. The light attenuation of the laser was caused by scattering rather
than by absorption, since the laser light irradiates a red corpuscle.
The principle of the
method is also shown by a schematic diagram in Fig. 4.2. Although the light attenuation due to light
scattering in a weak solution has been discussed in detail in the literature3,4),
Lambert’s law of simple estimation of attenuation has been used, whereby the
light decreases exponentially with the path length in the medium. That is, the light
Fig. 4.2 Schematic diagram of the optics.
power
Io at a distance x from the entrance is related to the incident
light power Ii as
follows,
|
|
(4.1) |
where
![]() is an absorption
coefficient which depends only on the concentration or the density of the
subject n to be measured. Applying Eq. (4.1) to the present method (see Fig.
4.2), the light power I2 received in the second sensor S2
can be related to the light power I1, received in the first sensor S1
as follows,
is an absorption
coefficient which depends only on the concentration or the density of the
subject n to be measured. Applying Eq. (4.1) to the present method (see Fig.
4.2), the light power I2 received in the second sensor S2
can be related to the light power I1, received in the first sensor S1
as follows,
|
|
(4.2) |
|
where |
|
Where,
T and T' are the transmissivities of the beam splitter and the test cell glass,
respectively, r' and r are the reflexibilities of the beam splitter and the
side mirrors in the cell, respectively, p is a normalized optical path length
defined by p=x/L', where x shows a total optical path length. As is shown in
Eq.(4.2), the normalized output light power I2/I1 is
directly proportional to Io (x)/Ii. A logarithmic
expression of Eq.(2) is given as,
|
|
(4.3) |
An
absorbance defined by log(I2/I1) is thus directly
proportional to p. As shown in Fig. 4.3, the linearity between log(I2/I1)
and p was determined experimentally. The gradient of the straight
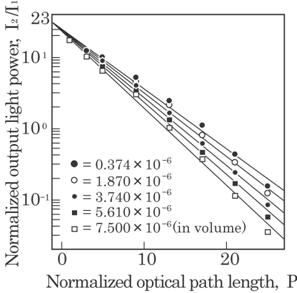
Fig. 4.3 Effect
of the optical path length, p, on the normalized output light power I2/I1
(in a logarithmic scale) for blood concentration, n.
line,
![]() , shows an apparent absorption coefficient
, shows an apparent absorption coefficient ![]() , from which an absorption coefficient
, from which an absorption coefficient ![]() can be calculated as
follows,
can be calculated as
follows,
|
|
(4.4) |
The
multi-reflections technique does not allow us to set the incident angle of the
laser beam to be normal to the mirrors in order to maintain its consecutive
reflections. This requires the term ![]() in Eq.(4.4), which
compensates for its effects on
in Eq.(4.4), which
compensates for its effects on ![]() . In this setup, the value of p in the equation is usually
larger than three and the magnitude of the effects of the shift is considered
to be less than 3%.
. In this setup, the value of p in the equation is usually
larger than three and the magnitude of the effects of the shift is considered
to be less than 3%.
The measured data of the
light power I1 and I2 are processed by a data processing
system, shown in Fig. 4.4. The continuous analog signals of I1 and I2
are sampled, digitized and stored
in
a computer where the operation of I2/I1 is completed.
Results are given in the form of curves after smoothing. The resolution of the
data acquisition system is 12 bits and the sampling rate is about 800/s. One
data point in the figure is made by averaging 50 measured data, and then
requires 63 ms sampling time.
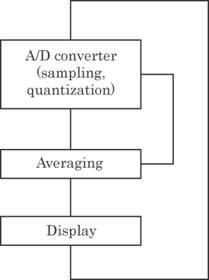
Fig. 4.4 Block diagram for the data acquisition system.
4.1.3 Experimental Results and Discussions
Before taking
experimental data, measurements were made in order to determine the system
parameters of the optical components, such as the transmissivity (T and T'),
and the reflection coefficient, (r and r'). The measurements gave T=0.93,
T'=0.90, r=0.90 and r'=0.04. This gives us T2T'/(r'r)=21.6, which is
in good agreement with the experimental data obtained at p=0 in Fig. 4.3.
First, the effects of
the optical path length were investigated. Experiments were carried out by
changing only the optical path length p, keeping the concentration and laser
output constant. Second, a series of experiments were conducted for various
concentrations and laser outputs. Results obtained are summarized in Figs. 4.3
and 4.5. The normalized output light power I2/I1 in the
logarithmic scale decreases linearly with the normalized optical path length p
as shown in Fig. 4.3, as well as with the concentration n, as shown in Fig.
4.5. The straight lines in Figs. 4.3 and 4.5 correspond to each normalized
optical path length and concentration, respectively, which were obtained by the
least squares method. It can be seen from these two figures that the normalized
output power decreases almost exponentially with the product of the normalized
optical path length p and the concentration n. Combining this fact with
Eq.(4.2) implies that the absorption coefficient ![]() is to be proportional
to n.
is to be proportional
to n.
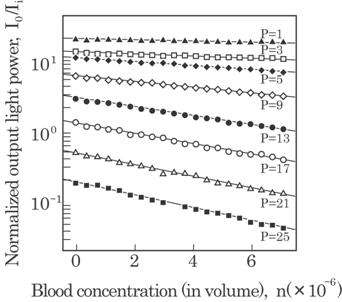
Fig. 4.5
Effect of the blood concentration, n, on the normalized output light power
I2/I1 (in a logarithmic scale) for various optical path
length, p.
The absorption
coefficient ![]() for each concentration
n is shown in Fig. 4.6, which is determined from the gradient of the straight
lines in Fig. 4.3.
for each concentration
n is shown in Fig. 4.6, which is determined from the gradient of the straight
lines in Fig. 4.3.
As seen in this figure,
the absorption coefficient ![]() increases linearly
with concentration n as discussed above, and can be expressed as follows,
increases linearly
with concentration n as discussed above, and can be expressed as follows,
|
|
(4.5) |
where
c is a constant independent of concentration n and optical path length p. n0
is the absorption coefficient of the solution without blood and is estimated
experimentally to be n0=3.55![]() 10-4/mm, as seen in Fig. 4.6. The constant c can
also be determined experimentally by the gradient of the straight line in Fig.
4.6 and is calculated as 36.4/(mm
10-4/mm, as seen in Fig. 4.6. The constant c can
also be determined experimentally by the gradient of the straight line in Fig.
4.6 and is calculated as 36.4/(mm![]() concentration in volume). It depends only on the interaction
between blood and the laser, and therefore the wavelength of the laser plays an
important role in determining c.
concentration in volume). It depends only on the interaction
between blood and the laser, and therefore the wavelength of the laser plays an
important role in determining c.
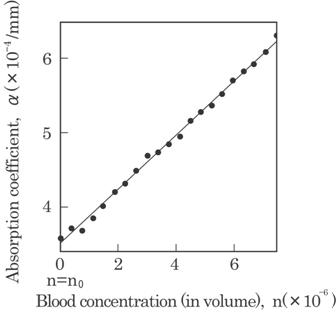
Fig. 4.6 Effect of the blood concentration, n, on the
absorption coefficient, ![]() .
.
When red laser light is
used, as in this case, red corpuscles scatter the red light; the constant c is
mainly determined not by absorption but by scattering. If a blue laser is used,
on the other hand, the attenuation is caused by absorption. Combining Eq. (4.5) with Lambert's law
(Eq.(4.2)) results in the following Lambert-Beer's law5) which is
applicable for a diluted solution, as in our case,
|
|
(4.6) |
The
sensitivity is determined in practice by dividing an increment of the
normalized output laser power by the corresponding increment of the blood
concentration (n) in a solution, i.e.,
|
|
(4.7) |
Then
the relative sensitivity K divided by S(1) gives,
|
|
(4.8) |
The
sensitivity for p=1 corresponds to one of the conventional sensors. It is
apparent that the sensitivity of the present method is p times higher than that
of conventional sensors, although there is an advantage with the conventional
sensors in that they do not require an expensive laser (an economical laser
diode is quite enough for conventional sensors since the path length is
shorter).
The normalized optical
path length p can be multiplied by repeating the reflection on the pair of side
mirrors, if necessary, to increase the sensitivity. However, the maximum sensitivity is limited
by a cross sectional area of the laser beam after the multi-reflections because
the laser beams should not overlap each other on the side mirrors. The maximum
sensitivity can then be given by pmax=W'/d, where W' is a width of
the side mirrors as shown in Fig. 4.1, and d the laser beam diameter.
The normalized output
power I2/I1 is completely independent of the fluctuations
of the laser output power, as can be seen in Eqs. (4.2) and (4.3). This means
that a laser can be used without any complicated stabilizing equipment or
compensator for the light source, and is another distinguishing feature of the
present system, in addition to its high sensitivity. The independence of I2/I1
from the laser fluctuations has been confirmed by varying the laser output over
an intentionally wide range. The result is shown in Fig. 4.7. The normalized
output laser power is almost constant over the wide range of the laser output
I/Imax where Imax is the maximum output power of the
laser.
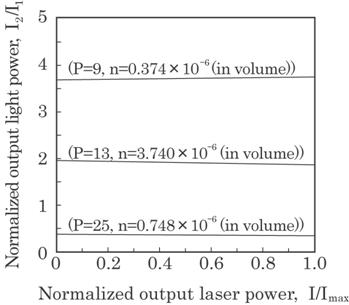
Fig. 4.7
Fluctuations of the normalized output power, I2/I1.
(The laser output power, I, is normalized by the maximum output power, IMAX.)
The cell configuration
used in this study is rectangular as shown in Fig. 4.1. However, a cylindrical
cell, as shown in Fig. 4.8, may be more practical from the view point of
commercial production. With this configuration, star-shape multi-reflections
can be applied and then both the inlet and outlet of the laser lights can
access the same window.
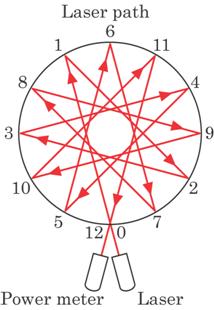
Fig. 4.8 A proposed cylindrical configuration for a
practical sensor.
In conclusions, the
following results were obtained.
(1) The
sensitivity of the sensor for blood leak detection has been improved by the use
of a beam splitter and a pair of side mirrors, which gives us about a few tens
of times higher sensitivity than conventional sensors on the market.
(2)
Further, the fluctuations of the laser power are completely compensated only by
using a beam splitter.
(3)
The practical sensor with the cylindrical cell has been proposed.
4.2 Dye Color Sensor
4.2.1 Introduction
In a dyeing process, it
is the most important to dye a cloth with consistent color. The tinting power
of dye, however, depends on its concentration, the material to be dyed, the
temperature of the dye, and other parameters. The concentration of each color
dye in a dye mixture decreases with time. The color dyes consumed must be replenished
instantaneously to maintain the same tint. A realtime measurement of a dye
concentration is then essential for this purpose.6)
A typical method now
used practically is spectrum analysis using a high power light source. This
method, however, is expensive and takes tens minutes to produce each
measurement because a precise measurement requires a high spectral sensitivity
and further dilution of the dye. A real-time measurement is thus practically
impossible.
The principle of a
real-time optical sensor for measuring dye concentration and the result of
preliminary experiments using a semiconductor laser have been reported
previously.7) In this section, the flexibility of a sensor system is
discussed from the viewpoint of practical use.
4.2.2 Principle and Method
Figure 4.9 shows the
principle of the method. Laser light containing the three base colors
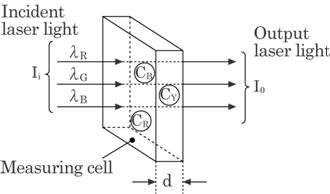
Fig. 4.9 Optical principle of the method. A part
of the incident light of three primary colors is
absorbed
in a dye mixture consisting of the three primary dye colors.
is
guided into a measuring cell. Part of the light is absorbed in the cell and the
rest passes through the cell and is received on a photodiode. The intensity of
the transmitted light can be expressed by Beer's law,8) if the dye
is diluted, as
|
|
(4.9) |
Where
Ii represents the power of the incident laser light, Io
the output power of the transmitted laser light, K is an absorption
coefficient, d is the cell width. The overall concentration, n, includes the
concentration of a dye, nx, and a reduced concentration, no,
taking account of the optical glass of the cell walls and additives for dyeing,
etc. As is shown in Eq. (4.9), the absorbance defined by log(Io/Ii)
is in direct proportion to nd and the absorption coefficient can then be given
as an absolute value of a gradient of the straight line absorption curve.
A dye can be mixed with
three base colors, i.e, red, yellow and blue base dyes. Unknown parameters to
be solved are thus the dye concentration of these three base colors. Three
pieces of information are therefore essential for the solution. These can be
obtained from the transmitted light power of three base colors. Light of
wavelength ![]() R=670 nm from a semiconductor laser and
wavelengths of
R=670 nm from a semiconductor laser and
wavelengths of ![]() G=515 nm and
G=515 nm and ![]() B=458 nm from a multiline Ar ion laser are used
for the light sources.
B=458 nm from a multiline Ar ion laser are used
for the light sources.
The absorption
coefficient depends mainly on the wavelength of the light ![]() (
(![]() R,
R, ![]() G,
G, ![]() B ) and the dye color C(
B ) and the dye color C(![]() R,
R, ![]() Y,
Y, ![]() B ). The absorption coefficient has then nine
components:
B ). The absorption coefficient has then nine
components:
|
|
(4.10) |
The
dye toning mixed with three base color dyes involves no chemical reactions. The
light attenuation is then proportional to the product of each attenuation by
the individual color dyes. The superposition principle for light attenuation,
therefore, can be applied to the present case where many color dyes are mixed
together. The assumption will be realized as discussed in section 4.1. The
transmitted light powers through the mixed dye are expressed as follows from
Eqs. (4.9) and (4.10):
|
|
|
where
|
|
(4.11) |

The
concentration of each dye color can then be obtained as,
|
|
(4.12) |
The
concentration sensitivity of the sensor, in other words, the resolving power of
the concentration, is defined by a small change of concentration due to a small
change of the light power. It can, therefore, be given as,
|
|
(4.13) |
Where
the negative signs in Eqs. (4.12) and (4.13) imply that an increase of light
power corresponds to a decrease of the concentration. Figure 4.10 shows the
optical arrangement and the system of the sensor. Any wavelength of laser light
can be selected by properly choosing the shielding plates
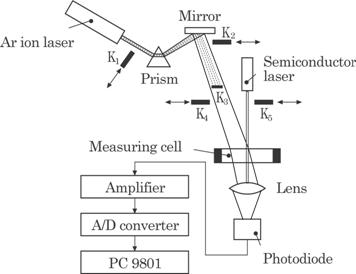
Fig. 4.10 Optical arrangement and sensor system.
cell
is focused on a photodiode and converted to an electric signal. The signal is
amplified, sampled and digitized in 12 bits. The maximum sampling
frequency
of the data acquisition is limited to about 1 kHz by the A/D converter. The
digitized signal is used in Eq. (4.12) to calculate the concentration and the
results are displayed on the monitor. All the data used in this calculation are
obtained by averaging by 80 samples.
The dyes used in the
experiments are color indication numbers of C.I. Reactive Red 112, C.I.
Reactive Yellow 15 and C.I. Reactive Black 5. These are all ionized in water.
4.2.3 Results and Discussions
A. Results
The output power of
laser light was measured for a small change of the concentration. Figure 4.11 shows an example with a laser
light of wavelength ![]() R = 670 nm and blue color dyes. As seen in this
figure, the logarithm of output laser power decreases almost linearly
R = 670 nm and blue color dyes. As seen in this
figure, the logarithm of output laser power decreases almost linearly
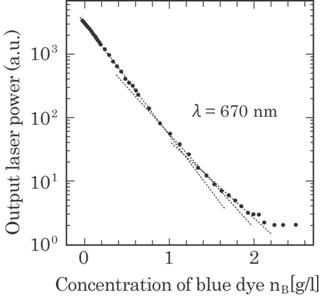
Fig. 4.11 Output power of the laser light with a
wavelength ![]() R =670 nm passing through a dye solution with
various concentrations of blue dye.
R =670 nm passing through a dye solution with
various concentrations of blue dye.
with
an increase of dye concentration in a limited range of concentration. This indicates
the validity of the Lambert-Beer's law expressed in Eq. (4.9). The slope, -Kd,
has been calculated by the method of the least-squares fit. As seen in the
figure, the absolute value of the slope, Kd decreases slightly as the
concentration becomes high (the range of practical use). The small change of
slope would be one of the major reasons for error of this method.
The value of the
absorption coefficient in this case was calculated as K(![]() R,CB)=7.28 (g/l)-1cm-1
for d=0.55 cm. Similar experiments were run for all combinations of the three
base color lights and dyes. Table 4.1 shows all the data for K. The value
changes on a large scale, depending on the combination of laser light and dye
colors. This enables us to increase the sensitivity of the method to a level
which is high enough for practical use.
R,CB)=7.28 (g/l)-1cm-1
for d=0.55 cm. Similar experiments were run for all combinations of the three
base color lights and dyes. Table 4.1 shows all the data for K. The value
changes on a large scale, depending on the combination of laser light and dye
colors. This enables us to increase the sensitivity of the method to a level
which is high enough for practical use.
Table4.1 Absorption
coefficients for all combinations of three basic lights and dyes.
|
K( |
Measured
value g/(l*cm) |
|
K( |
0.0360 |
|
K( |
0.00412 |
|
K( |
7.28 |
|
K( |
109 |
|
K( |
2.72 |
|
K( |
34.8 |
|
K( |
61.3 |
|
K( |
27.4 |
|
K( |
20.8 |
Using the data in table
4.1 in Eq. (4.12), we obtain an expression for each concentration,
|
|
(4.14) |
An experiment of
increasing each color dye successively was carried out to confirm the
reliability of the method. The dye concentration in the measuring cell filled
with water was successively increased by droplets of high concentration dye.
The output of the laser light was measured for each droplet and was used for
the calculation of the dye concentration. Figure 4.12 shows an example of the
calculated concentration for blue dye. As shown in this figure, the calculated
concentration of blue color dye changes only by the droplets of blue color dye.
The values of the change by both the droplets are about 0.009 and 0.016 g/l,
respectively, which are in good agreement with the real change of 0.013 g/l.
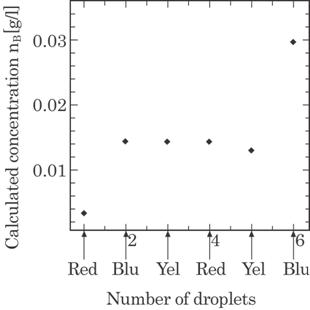
Fig4.12 Calculated concentration of blue dye for droplets of
each color of dye.
The resolving power of
the concentration, shown in Eq. (4.13), can also be obtained by using the data
in table 1, as follows,
|
|
(4.15) |
Thus
the resolving power depends directly on the resolution of the data acquisition
system for the output light power, ![]() Io/Io, which is given by the A/D
converter if the resolving power of the photodiode is sufficient. The total
range of light output is between 1 and 256, that is, the resolving power is
1/256, when the A/D converter with 8 bits is used. As an example, if the light
power changes for three base color of light are (
Io/Io, which is given by the A/D
converter if the resolving power of the photodiode is sufficient. The total
range of light output is between 1 and 256, that is, the resolving power is
1/256, when the A/D converter with 8 bits is used. As an example, if the light
power changes for three base color of light are (![]() Io/Io)R = 0.01, (
Io/Io)R = 0.01, (![]() Io/Io)G = 0.1 and (
Io/Io)G = 0.1 and (![]() Io/Io)B = 0.1 , the
resolving power of the concentration are calculated as
Io/Io)B = 0.1 , the
resolving power of the concentration are calculated as ![]() n R = -0.788 mg/l,
n R = -0.788 mg/l, ![]() n Y = -2.90 mg/l and
n Y = -2.90 mg/l and ![]() n B = -2.49 mg/l. These are in good agreement to
the experimental result in Fig. 4.12.
n B = -2.49 mg/l. These are in good agreement to
the experimental result in Fig. 4.12.
B Discussions
Firstly, the validity of
the superposition principle for the light attenuation is discussed as follows.
The reliability of this method is based on the superposition principle for the
light attenuation. This can be considered to be valid from the fact that the
dye mixing involves no chemical reaction. This has been examined
experimentally. Figure 4.13 shows an example of light attenuation through the
mixed dyes. The absorption coefficient K(![]() R,CR) is almost independent of the blue
dye. This validates the adaptation of the superposition principle. A small
change of K(R R, C R) will yield an error as discussed in
the next section.
R,CR) is almost independent of the blue
dye. This validates the adaptation of the superposition principle. A small
change of K(R R, C R) will yield an error as discussed in
the next section.
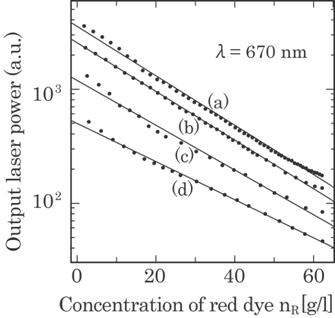
Fig. 4.13 Output power of the laser light with a
wavelength ![]() R =670 nm passing through a
R =670 nm passing through a
dye
solution with various concentrations of red color dye added with and without
blue color
dye: (a) without blue color dye, (b) with blue color dye of n B
=0.0625 g/l,
(c) n
B =0.125 g/l, and (d) n B =0.345 g/l.
Secondly, the error due
to a small change of absorption coefficient is discussed as follows. In figure
4.12, a difference between true and calculated values of concentration and also
the concentration change of blue dye due to the gradual addition of red dye and
yellow dye, are sources of error. The former was found to be about 3 mg/l and
the latter about 1 mg/l. Three major sources of error may be considered. The
first results from light fluctuation due to ambient light. However, the ratio
of the intensity of ambient light to the laser light has been made less than
1/1000 by shielding the light receiving system. The value is less than the
sensitivity and can be neglected. The second factor results from non-linearity
between log(Io/Ii) and (n) in Eqs. (4.9) or (4.11), as
shown in figure 4.11, when the concentration becomes high. We can, however, make
the apparent concentration low enough by using a thin cell width as discussed
in section 4.2.3 A. The last results from a small change of the absorption
coefficient due to the mixing of dye as described in section 4.1. This will be
a substantial problem for this method. A small change of concentration [![]() n] due to a small change of absorption coefficient [
n] due to a small change of absorption coefficient [![]() K] can be calculated from Eq. (4.12),
K] can be calculated from Eq. (4.12),
|
|
(4.16) |
where
[K]-1 shows an inverse of the matrix [K]. Thus, the change of dye
concentration may be the same order of the change of the absorption
coefficient.
Thirdly, the
adaptability for practical use is discussed as follows. Figure 4.14 shows an
example of the output laser power for an extremely high absorption coefficient.
The measurable range of the concentration is between 0 and 0.63 g/l in this
case. However, we can measure higher concentrations by using a thinner cell
width d, because the absorption a coefficient K is the slope of a straight line
between ln(Io/Ii) and (nd) as seen in Eq. (4.9). That
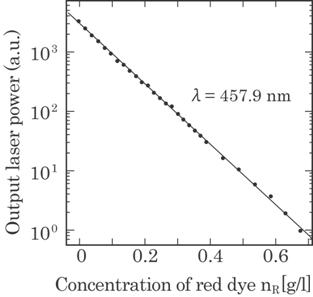
Fig. 4.14 Output power
of the laser light with a wavelength ![]() B =458 nm passing through a
B =458 nm passing through a
dye solution with various concentrations of blue color dye.
is,
we can, apparently, make the concentration low by using thin cell width. As an
example, if a concentration range between 0 and 3 g/l is required, it can,
theoretically, be achieved only by making the cell width about d=1 mm. This
will, however, cause an error due to a concentration fluctuation in such a thin
cell width. One useful method to solve this problem may be to incorporate the
light emitter and receiver in one unit as a sensor head using an optical fiber,
as shown in Fig. 4.15. Practically only the sensor head is immersed in the dye
solution.
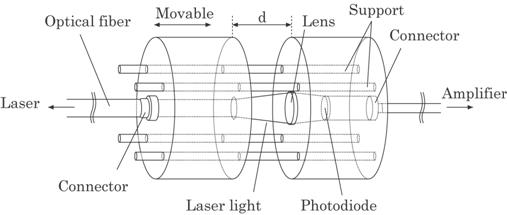
Fig. 4.15 Illustration of a proposed optical sensor head.
Lastly, the optimum
wavelength of the laser light is discussed as follows. Three base colors of
lights with the wavelengths ![]() R = 670 nm,
R = 670 nm, ![]() G = 515 nm and
G = 515 nm and ![]() B = 458 nm were used for the light sources in this
study. However, another wavelength may also be used effectively. A large
difference in absorbance, defined by log(Io/Ii), for each
wavelength and dye color is desirable for high sensitivity. Figure 4.16 shows
the absorption spectrum for three base color dyes. It may be concluded from
Fig. 4.16 that the desirable wavelengths of the laser lights are 430 nm, 460 nm
510 nm, 540 nm and 580 nm. Any three wavelengths in these five wavelengths,
e.g., 460 nm, 510 nm and 580 nm, will be sufficient for determining three
unknown parameters as discussed in this paper.
B = 458 nm were used for the light sources in this
study. However, another wavelength may also be used effectively. A large
difference in absorbance, defined by log(Io/Ii), for each
wavelength and dye color is desirable for high sensitivity. Figure 4.16 shows
the absorption spectrum for three base color dyes. It may be concluded from
Fig. 4.16 that the desirable wavelengths of the laser lights are 430 nm, 460 nm
510 nm, 540 nm and 580 nm. Any three wavelengths in these five wavelengths,
e.g., 460 nm, 510 nm and 580 nm, will be sufficient for determining three
unknown parameters as discussed in this paper.
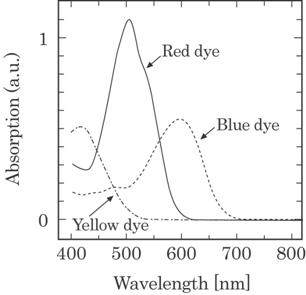
Fig. 4.16 Absorption spectra of three base color dyes.
In conclusions, the
following results were obtained.
(1) The
sensor system can be used effectively for monitoring or detecting a small
change of dye concentration.
(2) The
concentration sensitivity of the method was about a few mg/l and may be
satisfactory for dyeing machines presently on the market.
4.3 Thickness Sensor for Polyethylene Foam Sheet
4.3.1 Introduction
Numerous optical sensors
have recently been developed in response to the fact that small-size
semiconductor lasers have become commercially available at a reasonable cost. 9)
Although the application of these sensors and lasers involves a wide
range of laws and theories in physics, Lambert's law is one of the most
frequently used to estimate light attenuation. The law was successfully
employed in a high sensitivity optical blood leakage detection system10)
and also in a dye concentration measurement system11).
In the present study,
light attenuation has been used to measure the thickness of sheets of
polyethylene foam and polystyrene. Polyethylene is widely used for a variety of
products such as bath mats, packing sheets for shipping and heat insulators for
building comfort. Polystyrene is mainly used for cups and hot food containers.
The thickness of the foam sheet is important to the makers from the viewpoint
of standardization of manufacture. The major difficulty in thickness
measurement of foam sheets is caused by the heterogeneous cell structure of the
foam, which yields enormous fluctuations in the measured data depending on the
measurement technique and on the sampling locations. An averaging method has
been adopted for solving this difficulty and enables us to determine the
thickness with good accuracy. A complete measuring system has also been
constructed in order to demonstrate the suitability of the present method for
industrial use.
4.3.2 Principle and Method
A. Principle
Figure 4.17 shows a
fundamental illustration of a light attenuation process. Polyethylene
or
polystyrene foam consists of small cells filled with air. The light is
scattered at each cell wall as it passes through the foam. The transmitted
light intensity, It, is then given by the multiplication of the
transmittance, Tk, on each cell surface in the measuring optical
path, as follows12):
|
|
(4.17) |
Where
Ii is the input light intensity and N the number of the cell surface
along the optical path. In particular, T1 shows the transmittance on
the surface of the foam sheet. The transmittance, Tk(k=1,2, ![]() N), and the total number, N, are then a function of an
irradiated position x, as shown in Fig. 4.17(a). Thus, the output, i.e.,
transmitted light intensity, depends on the position.
N), and the total number, N, are then a function of an
irradiated position x, as shown in Fig. 4.17(a). Thus, the output, i.e.,
transmitted light intensity, depends on the position.
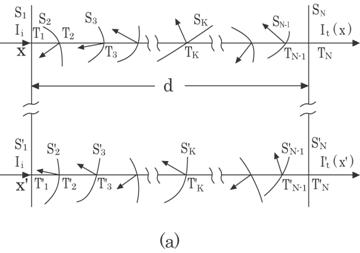
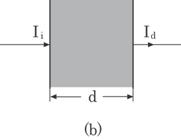
Fig. 4.17 Light attenuation in a foam sheet from
the microscopic viewpoint (a), and from the macroscopic viewpoint (b).
We expect, however, that
the output light intensity after passing through an optical path d, Id,
follows Lambert's law5) if a sample is uniform, as given by
|
or,
|
(4.18) |
where
![]() is an absorption
coefficient. This is an approximate expression for light attenuation form a
macroscopic viewpoint. That is, the output intensity, Id, is
considered to be the mean value of It (x) for many sampling points
around the measuring point.
is an absorption
coefficient. This is an approximate expression for light attenuation form a
macroscopic viewpoint. That is, the output intensity, Id, is
considered to be the mean value of It (x) for many sampling points
around the measuring point.
As is shown in the
following section, the mean values of T(x), <T(x)>, at each measuring
point x, are approximately equal and we can then assume:
|
|
(4.19) |
Using
Eqs. (4.17) and (4.18), and the relation given in Eq. (4.19), we obtain the following
relation:
|
|
(4.20) |
Equation
(4.18) gives us information on the thickness and Eq. (4.20) on the cell
density, N/d or the cell transmittance.
B. Method
Figure 4.18 shows the
experimental set-up for a measurement. Laser light of wavelength 670 nm from a
semiconductor laser passes through a polyethylene sheet. The transmitted light diverges by scattering
in the foam and is focused on a light meter. The light power, Id, is
processed by the data acquisition system shown schematically in Fig. 4.19.
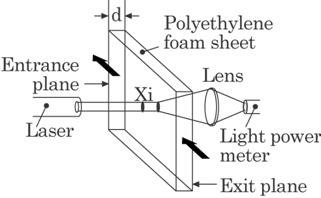
Fig. 4.18 Fundamental optics of the experimental set-up.
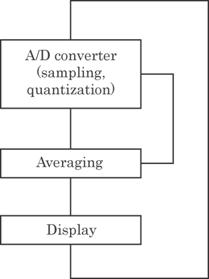
Fig. 4.19 Block diagram of the data acquisition and
processing system.
The continuous analog
signals of Id are sampled, digitized and stored in a computer
memory. Results are given in the form of curves after smoothing. The resolution
of the data acquisition system is 12 bits and the sampling rate is about 400Hz.
Figure 4.20 shows a
particular experimental set-up to measure the effect of cell structure on the
transmittance, e.g., light attenuation. The polyethylene foam sheet is placed
between a pair of transparent optical glass plates, slightly inclined to the
normal to the laser beam. The thickness of the sandwiched foam sheet, d, is
changed by compressing the glass plate. The optical path length through the
sheet foam is thus changed by the compression of the glass plate or its
inclination.
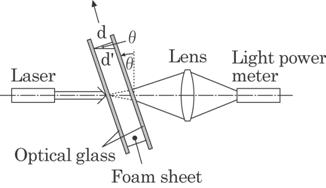
Fig. 4.20 Optics to measure the effects of
compression and inclination of a semi-transparent foam sheet.
4.3.3 Results and Discussion
A. Results
Figure 4.21 shows an
example of the transmitted light power at each measuring point. As shown, each
data point differs to a great extent from the mean value, the range of which
reaches
70%. This is attributed to the difference of total transmittance, T(x), along
each optical path, as shown in Fig. 4.17(a), T1 may be the major
factor. The difference can, however, be reduced by smoothing, i.e., averaging.
Two technical methods, both of which are based on the same principle, are
available for this smoothing. One is to enlarge the spot size of the laser
irradiation. This method, however, necessitates the use of a large focusing
lens and further to cut an ambient light off to a very small amount. The other
method, used in this study, is to make many measurements around a small region.
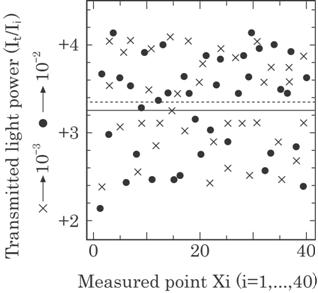
Fig. 4.21 Transmitted light power at each point.
(![]() )
d1=2.76 mm; (
)
d1=2.76 mm; (![]() ) d2=5.58 mm; (
) d2=5.58 mm; (![]() ) Mean
) Mean
value of
3.35![]() 10-3 for d2=5.58 mm; (-) Mean value of
3.24
10-3 for d2=5.58 mm; (-) Mean value of
3.24![]() 10-2 for d1=2.76 mm.
10-2 for d1=2.76 mm.
The smoothing effect is
shown in Fig. 4.22. As shown, smoothing over 80 points restricts the
fluctuation of the mean value within a range of 1%. All the data except one
example given in Fig. 4.21 were averaged over 80 points.
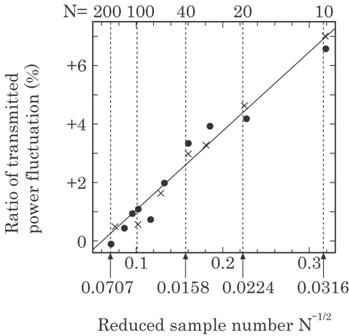
Fig. 4.22 Relation between the transmitted light
power fluctuation (%) and the reduced
sample
number.
Fig. 4.23 shows an
example of the relation between transmitted light power and foam thickness. It
can be seen that the transmitted light power decreases exponentially with the
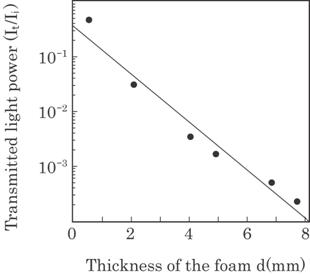
Fig. 4.23 Relation between the averaged light power and the
foam thickness d.
thickness.
A straight line can be obtained by the method of a least mean square fit. The
gradient of the straight line gives the absorption coefficient, ![]() , in Eq. (4.18). The value depends only on the property of
the material used. A value of the thickness, d, has to be known for a
determination of absorption coefficient,
, in Eq. (4.18). The value depends only on the property of
the material used. A value of the thickness, d, has to be known for a
determination of absorption coefficient, ![]() , and should be measured by another method, e.g., the gage
method.
, and should be measured by another method, e.g., the gage
method.
In applying the method
practically, the absorption coefficient, ![]() , has to be determined repeatedly for each product.
, has to be determined repeatedly for each product.
B. Discussion
The effect of the cell
structure on the transmitted light power was examined using the optical
arrangement shown in Fig. 4.20, where the optical path length is changed. The
number of cell surfaces remained constant when we compressed the foam sheet and
so the transmitted light power may be assumed unchanged.
Figure 4.24 shows an
example of the effect of sheet compression on the transmitted light power. As
expected, the transmitted light power was almost the same for each compressed
foam sheet, i.e., d=3.7 mm and d=3.2 mm. This implies that each cell surface
has an equal
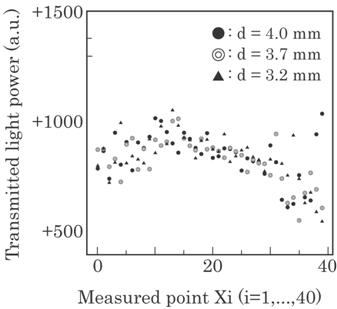
Fig. 4.24 Transmitted light power under
squeezing. (![]() )
Normal foam sheet; (
)
Normal foam sheet; (![]() ),
(
),
(![]() )
)
squeezed
foam sheets. Each datum is an averaged value over 80 points in the
vicinity
of each other.
transmittance
and that the total transmittance through the optical path depends on the
transmittance of the material and the number of cell surfaces. That is, the
assumption in Eq. (4.19) is justified.
The optical path length
increases when the normal of the foam sheet is inclined to the optical axis,
and then the transmitted light decreases. In this case, the foam thickness, d,
has to be replaced by (d/cos![]() -1), as shown in Fig. 4.20. Figure 4.25 shows the effects on
the transmitted light power, where the abscissa shows reduced inclination,
1/cos
-1), as shown in Fig. 4.20. Figure 4.25 shows the effects on
the transmitted light power, where the abscissa shows reduced inclination,
1/cos ![]() -1. This figure also implies the validation of Eq. (4.19).
-1. This figure also implies the validation of Eq. (4.19).
The accuracy of this
method depends on the linearity between the thickness and the decrease in the
transmitted light power, as shown in Eq. (4.18). The light fluctuation due to
ambient light introduces errors. It is very difficult to discriminate laser
light from ambient light, but it is easy to reduce the effect to ambient light.
Two methods are available. One is to use a pulsed laser of high peak power, but
this is too expensive for our purpose. The other is to cover the laser light
receiving system with a proper cylinder case. This can reduce the ambient light
power below 0.05% of the maximum power of the transmitted laser light.
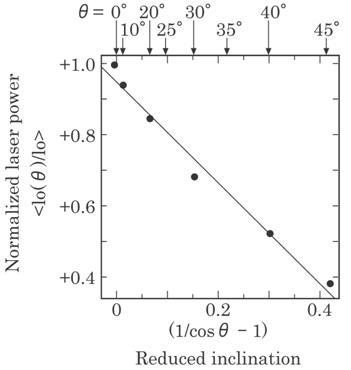
Fig. 4.25 Effect of inclination on the
transmitted light power. The ordinate shows the light
power
normalized by the one for ![]() =0 and the abscissa the reduced inclination
=0 and the abscissa the reduced inclination
(1/cos![]() -1).
-1).
4.3.4 Practical Applications
In practical foam
production, molten polyethylene in an extruding machine is squeezed out from a
circular arc air nozzle and is formed to a sheet. The circular nozzle is
divided into a few small portions, each of which has a nozzle aperture which
can be controlled independently. The speed of output of the sheet is about 1-2
m/s and its width is about 2 m. The usual gage method of picking up contact
elements is therefore difficult. Furthermore, it can only measure the thickness
at both edges of the sheet. On the contrary, the present method may solve the
above disadvantages simultaneously. Figure 4.26 shows an example of the
practical optical set-up for the measurement. One optical sensor is desirable
for each nozzle, where a sensor signal is processed to control the nozzle
aperture. All the sensor signals from each sensor are processed on the computer
simultaneously. The thickness of each portion along the width can thus be
adjusted to the same thickness.
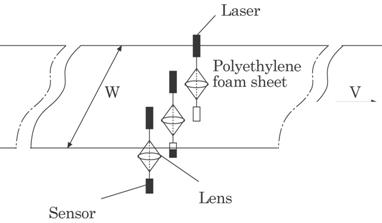
Fig. 4.26 Optical system for practical use.
Figure 4.27 shows an
example of the results. The sampling rate of this system was about
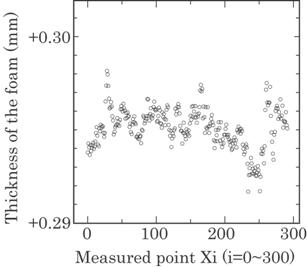
Fig. 4.27 Thickness of the polyethylene foam
sheet measured in the manufacturing process. Each datum was plotted at
intervals of 3 m and total length was 300 m.
400
Hz. The production speed of the foam sheet was 1.5 m/s. As discussed above, one
datum was given as the average of 80 points and then the average along a
0.3(=1.5*80/400) m length. The spot size of the laser was about 5 mm in
diameter at an irradiated surface and then each sampling point slightly
overlapped each other. The deviation of the thickness was found to be within
0.01 mm over 90 m from this figure. The deviations on other portions in the
width direction were kept within this range.
Figure 4.28 shows another
example of the measurement. This is a result given by the system developed for
the precise measurement for a food container. The foam sheet for a food
container was produced with relatively slow speed of about 10 cm/s. Each
sampling point was
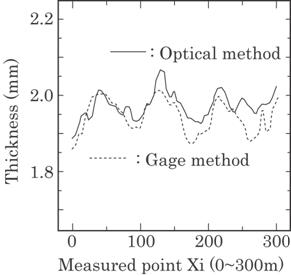
Fig. 4.28 Thickness of the polyethylene foam
sheet measured in the manufacturing process.
overlapped
close together. That is, each datum was not an average over totally different
points but over locally common points. The result by the usual gage method is also
shown for the comparison. Both results agreed quite well within a deviation of
20![]() m. From the result, the error of the method in this study is
supposed to be within a few tens of micrometers.
m. From the result, the error of the method in this study is
supposed to be within a few tens of micrometers.
In conclusions, the
following results were obtained.
(1) The
light attenuation was used in this measurement, and averaging enabled us to
determine the thickness precisely in spite of large fluctuations in measured
data due to the heterogeneous structure of the sheets.
(2)
Automatic thickness control can be accomplished in the manufacturing of these
sheets.
(3)
The error of this measurement is a few tens micrometers.
4.4 Weight Density Sensor for Row Glass Wool
4.4.1 Introduction
The glass has recently
been used more and more, in particular owing to the advancement of
manufacturing technique of high purity and glass fiber. An optical fiber in a
communication service is the representative example. The other examples are
processed goods of glass wool such as a dust proof paper, separator to insulate
electric current in a battery and heat-resisting and sound-resisting mats used
mainly in a car and a building. An efficiency of the finished goods, i.e.,
homogeneity in particular, depends on a manufacturing process, mainly on a
weight density of raw glass wool.
The weight density may
be measured by an attenuation of a sound wave and electromagnetic waves such as
microwave and light wave through the raw glass wool. A source of the microwave
will, however, be rather expensive for an industrial use. The sound wave will
have a troublesome problem of noise when it is used in the factory. That is, a
signal obtained by the sound wave of proper frequency for the measurement will
include rather large noise produced in the factory. The noise will usually include
all over the frequency range and we can not distinguish between signal and
noise. On the contrary, we can, easily screen the noise light from the signal
light.
We have previously
reported a new method to monitor the thickness of a semitransparent foam sheet
in realtime using a laser light13). The principle of the method is
based on the light attenuation through the foam sheet. The method can also be
applied to glass wool weight density since the thickness is directly
proportional to the weight density if the foam sheet is homogeneous. It was
very simple and was found to be effectively applied for industrial use. It has,
however, a drawback to scan the laser beam to examine all the area because an
intensity of the laser is rather small. The raw glass wool usually produced is
rather thick and then light attenuation and divergence through it become rather
large. It, therefore, requires a focusing lens for a transmitted laser light
due to a divergence through the glass wool. This prevents use of laser light as
a light source and photodiode as a light receiver.
In this section, we
propose a practical method to overcome these drawbacks, that is, high intensity
white light is used as a light source and a large scale solar cell as a light
receiver.
4.4.2 Method and System
The fundamental
principle of the method is based on the light attenuation theory12,13).
But the method in this paper is different from the previous one in two points
from a practical point of view. One is to use a white light with high intensity
instead of laser light. This enables us to use solar cell as a light sensor and
the method to be effectively applicable for high attenuation object. The other
is to use a solar cell as a light sensitive sensor instead of photodiode. The
solar cell, in itself, is not a light sensitive sensor but a converter from a
light power to an electric power. The solar cell has a large dimension as
compared to the photodiode. It makes, therefore, a spatial averaging over the
cell dimension without scanning the area. It can, further, measure a rather
diverged light through the thick semitransparent object such as glass wool
without focusing lens. The solar cell has, however, such disadvantages as a low
sensitivity to the light and incomplete characteristics in each cell. The low
sensitivity can be solved by using an intense light source and a large scale
cell. The incomplete characteristics can be compensated by using an amplifier
to each solar cell independently as in Fig. 4.29.
Figure 4.29 shows a
whole system used in a manufacturing plant. Four high intensity white light
sources with each output of 500 W were used. These were placed at a distance
about 800 mm from a top of the glass wool to illuminate it uniformly as
possible as we can. Sixteen solar cells of each dimension 90mm![]() 230mm were used as the light receivers. These were placed at
about 30mm from the bottom of the glass wool to receive the transmitted light
directly and at the same time to avoid an attachment of the glass wool to the
cells.
230mm were used as the light receivers. These were placed at
about 30mm from the bottom of the glass wool to receive the transmitted light
directly and at the same time to avoid an attachment of the glass wool to the
cells.
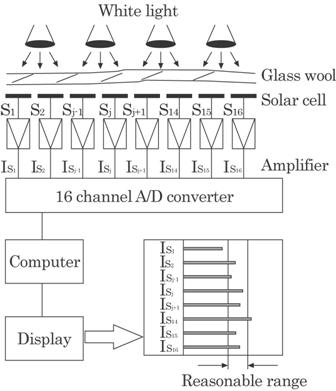
Fig. 4.29 Illustration of the system.
The outputs of each
solar cell are amplified independently to compensate the output characteristics
of each solar cell and the lack of uniformity of irradiated light intensity on
the glass wool. That is, all the outputs of each solar cell are adjusted by
each amplifier to show the same value under the same weight density. These
amplified signals are then digitized by an A/D converter, averaged by a
computer and displayed on the monitor as shown in Fig.4.29. Sampling time ts
of the data acquisition is about ts= 0.1s and a processed data is
obtained at an interval Td= 1s in this case. That is, one data is
obtained as a 10 times averaging ( n = Td/ts, n; times
for averaging). The data can, however, be obtained at an arbitrary time
interval by the computer control. The production speed v of the glass wool is
about v = 250mm/s and then the processed data on the monitor is a mean value
for an area of 90mm![]() 250mm(= 25mm
250mm(= 25mm![]() 10). Strictly speaking, the averaging area is not so as
discussed in 4.43.
10). Strictly speaking, the averaging area is not so as
discussed in 4.43.
Lamber's law5),
which gives a relation between input Ii and output Io
light intensity, can be expressed as follows,
|
|
(4.21) |
where
D shows the glass wool weight density of the corresponding area and k an
absorption coefficient which depends on a property of the material. Thus, a
natural logarithms of the light intensity ratio is in direct proportion to the
weight density. The weight density of a practical product has nearly a constant
value, D=Dc, as shown in Fig. 4.29. In this case, a small increment
in density, ![]() Dc, may causes a small decrease in output light
intensity,
Dc, may causes a small decrease in output light
intensity, ![]() Ioc, using a first approximation as follows,
Ioc, using a first approximation as follows,
|
|
(4.22) |
This
shows that a small increment in the weight density from about a constant
density Dc is in direct proportion to a small decrease in the output
light intensity Ioc. The error of this approximation is only 2% for ![]() Dc
Dc![]() 0.2, since e0.2-(1+0.2) = 0.021. We use Eq. (4.22)
in a practical application of this system.
0.2, since e0.2-(1+0.2) = 0.021. We use Eq. (4.22)
in a practical application of this system.
4.4.3 Result and Discussion
The system has
successfully been used in a manufacturing plant of Japan Inorganic Chemistry
Co. Ltd. at Yuki Factory, ![]() 25%.
25%.
Figure 4.30 shows an
example of the light intensity for one channel (by optical method) and the
measured weight density of the corresponding area (by direct method). Thus, the
tendency between both values by optical and direct methods with time flight is
found to be coincide perfectly with each other. All the data for 16 channels
have similar tendency.
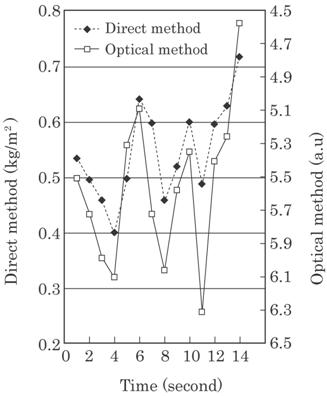
Fig. 4.30 Weight density of the raw glass wool by both
direct and optical methods.
Figure 4.31 shows both
change rates by optical and direct methods in Fig. 4.30 to discuss the validity
of this method. The optical change rate is different about 10% from the direct
one.
This
may be considered as an error of this optical method. It is not, however,
necessarily so since a cutting the raw glass wool into pieces is very difficult
and then the measured value itself includes some errors. The set point of this
weight density is 500 g/m2 in manufacturing plant. The averaged
values, however, is 547 g/m2 which is larger about 10% than that of
the set point. This is indispensable to assure the finished good's efficiency,
i.e., adiabatic and sound-proofing effectiveness. It was further found that the
change rate of optical value is always smaller than that of measured value.
This is unavoidable to this method which uses large scale photo-receiver for
measuring a light intensity through a moving object.
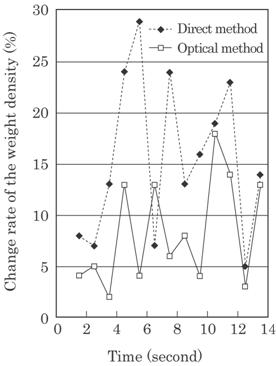
Fig. 4.31 Change rate of the weight density by
both direct and optical methods. Optical values are reversed.
Figure 4.32 shows this
principle. A piece of raw glass wool used for both measuring methods has a
dimension 9cm![]() 25cm. The solar cell having a dimension of 9cm
25cm. The solar cell having a dimension of 9cm![]() 23cm receives transmitted light corresponding to that area on
the glass wool. The glass wool moves
23cm receives transmitted light corresponding to that area on
the glass wool. The glass wool moves
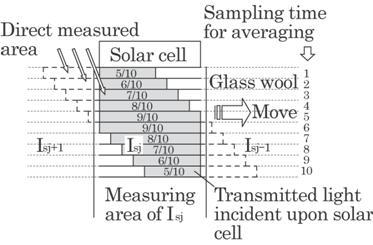
Fig. 4.32 Principle of the received light
intensity on the large scale solar cell from the measuring area of the raw
glass wool.
25mm
between each data sampling and 25cm between each processed data since it is
obtained by a ten times averaging of the sampling data. In the central region
of the piece, i.e., regions 5 and 6 of sampling time for averaging, the solar
cell receives 9/10 of the transmitted light from the measuring piece. But it
receives only a 5/10 from the measuring piece and a remaining part from the
adjacent piece as shown in this figure. The optical value, therefore,
shows
the results obtained from wider region than that of measuring piece. This is a
reason for the difference between measured and optical change rates. The
difference may be reduced slightly by taking a weighted mean in place of an
arithmetic mean used in this experiment. The method of a weighted mean can not,
however, settle the problem radically because the measured region for both
methods of optical and direct measurement is essentially different.
Errors within plus or
minus 10 % or so exist in our optical system as seen in Fig. 4.31. It can be,
however, decreased in accordance with 1/(N)1/2 from the theory of
error13), where N is an averaging times. To do this effectively, a
smaller size photo-receiver than that used in this system must be used for the
same measuring area and the sampling time of data acquisition must be reduced
considerably. This can effectively make N large without the essential problem
caused by using large photo-receiver. However, this inversely leaves a strong
point of using large scale solar cell described in chapter 1. In conclusion, we
must find out a meeting point between them.
The optical method in
this study can only measure a relative value of the weight density. The
correction is required to obtain an absolute value from the optical value. For
this purpose, the absorption coefficient k in equation (4.21) has to be
determined from some light outputs for some known weight densities, for
examples, 400 ,500 and 600 g/m2.
In conclusions, the
following results were obtained.
(1) The
optical method using a white light and a solar cell as a light source and light
receiver can be used successfully for the weight density measurement of raw
glass wool in real time.
(2)
The mean error of the method is about 10%.
(3) The
system has now been successfully used in a manufacturing plant to find out
inferior goods of more or less than 25% weight density. It can further be
applied for production process.
4.5 Rib Form Sensor for Polyethylene Sheet
4.5.1 Introduction
Polyethylene sheet has
been widely used in industry. For example, it has been used in a battery as an
impregnation material for sulfuric acid. For such applications, ribs are
usually constructed on the sheet surface to control the amount of sulfuric
acid; the amount of electricity generated and the life time of the battery are
determined by the size of the rib. The size of each rib, i.e., width and
height, and the separation between ribs have been measured by microscopic
observation in off-line. It is very laborious and time-consuming process.
Recently sensors were
introduced to this problem.14~16) They are costly, however, and
difficult to use in a manufacturing plant in real time; they can only measure a
surface contour of the sample in off-line.
In this section, we propose
an optical method and present a measuring system for the size of rib, the
separation between each rib, and the thickness of the polyethylene sheet.
4.5.2 Method and System
Figure 4.33 shows a
photograph of polyethylene sheet used in a battery, and Fig. 4.34 shows a
cross-sectional scheme of it. The sheet size is usually about 12cm in width,
about
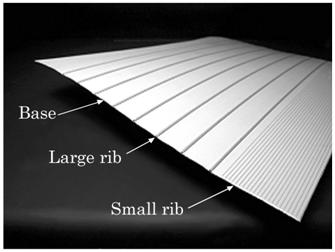
Fig. 4.33 Photograph of the polyethylene sheet with ribs on
the surface.
20cm
in length, and few tenths mm in thickness; ribs have been constructed on it.
Each rib size is a few tenths mm in width and a few tenths mm in height, and
the separation of it is about 10 mm. The purpose of this study is to measure
the following parameters concerning
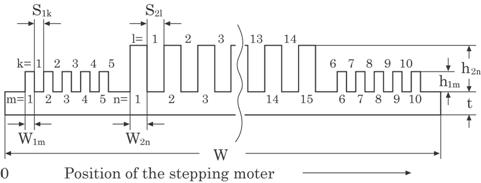
Fig. 4.34 Cross sectional view of the sheet.
the
polyethylene sheet; (i) the whole width W, (ii) the thickness t, (iii) the rib
separation S, (iv) the rib width w, and (v) the rib height h (see Fig. 4.34).
Figure 4.35 shows a
principle of the method, which is based on the fact that a probing light
intensity, i.e., a transmitted light intensity, is linearly proportional to the
gap between the shielding plate and the polyethylene sheet with a rib. A light
sheet was used as a probing light.
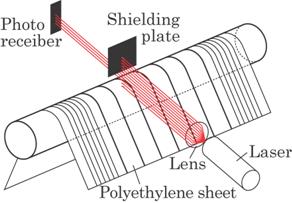
Fig. 4.35 Principle of the method.
A semiconductor laser
was used to form a thin light sheet, which was essential for measuring a small
width precisely.17) In this case, the width of the laser sheet
should be small enough compared to the width of the rib in order to obtain a
sharp edge of the rib, which determines the measuring precision of the width. A
light sheet of about 1/10 mm in width was used in this experiment. A silicon
photodiode was used as a light receiver. The height and width of the rib, the
separation between each rib, and also the thickness of the polyethylene sheet
can then be measured by scanning a sheet laser as shown in this figure. In this
experiment, a light source and a light receiver were fixed and a sample was
mounted on the stepping motor as shown in figure 4.37.
Figure 4.36 shows a
block diagram of the entire system, and figure 4.37 shows a photograph of the
equipment made for the experiment. The laser light intensity received on the
silicon photodiode was amplified to a level acceptable for A/D input, in this
case 5 V, and was digitized by a 12-bit A/D converter, i.e., 1~4096 steps. The
digitized intensity was then used for the calculation of rib size, separation
between ribs, and thickness of the polyethylene sheet.
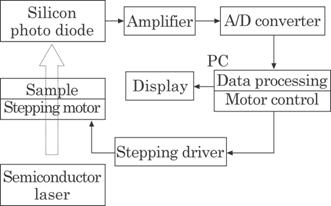
Fig. 4.36 Block diagram of the whole system.
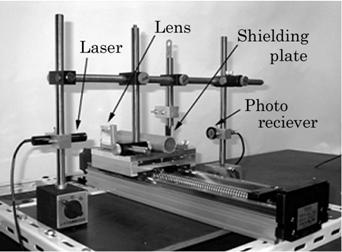
Fig. 4.37 Equipment of the system.
A control signal for
driving the stepping motor was about 100 Hz with a rectangular wave and was
synchronized with the received laser signal to measure the widths of the rib
and polyethylene sheet, and the separation between ribs. One cycle of the
rectangular wave drives the motor 1/100 mm and then the positioning precision
of this measurement is 1/100 mm. Then 120 seconds are required to scan the
entire sheet with the width of 120 mm. The sampling frequency of data
acquisition is about 1 kHz; 10 data are obtained within one cycle and a mean
value of these 10 data is used as a measured value of the received light
intensity. This averaging will reduce the measuring error due to a fluctuation
of the scattered light on the surface of polyethylene sheet. Figure 4.39 shows
these measured values at each position.
The error comes from a
change in the received light intensity due to laser output, and dust on the
light source and light receiver when the system is used in the factory. The
problem could, practically, be solved as follows. The measured intensity I is
normalized by light intensity I0 through a constant gap g0,
in this experiment g0=0.5 mm; the normalized light intensity, I/I0,
is used as data. The calculation was made by means of software.
4.5.3 Experimental Results and Discussions
The intensity of a laser
beam usually has a Gaussian distribution in a radial direction. This causes a
measurement error since a linear relation between the transmitted light
intensity I, and a gap g, is obtained under condition that the intensity
distribution along the laser sheet is constant. This can be solved by using a
central portion of the laser beam as a probing light. Figure 4.38 shows the
relation between the transmitted light intensity I, and the gap g. As shown in
this figure, the transmitted light intensity linearly increases with an
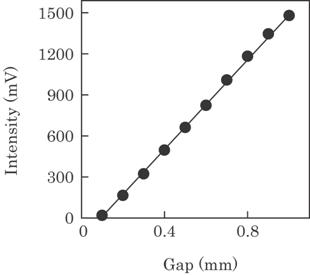
Fig. 4.38 Relation between transmitted light intensity I and
a gap g.
increase
of the gap.
Figure 4.39 shows
received light intensity versus position on the polyethylene sheet. Each datum
is a mean value of 10 sampling data as mentioned in section 4.5.2. In this
figure, the top and bottom were inverted to give the thickness of the
polyethylene sheet and the height of the rib directly.
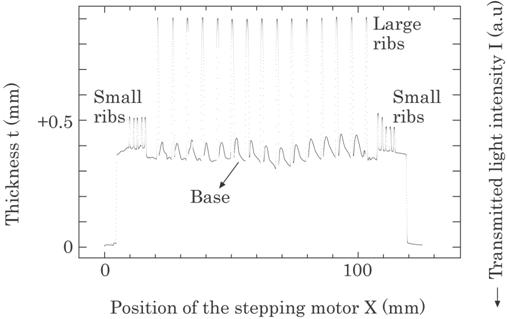
Fig. 4.39 Transmitted light intensity across the
sheet surface. In this figure, the top and
bottom of
the light intensity are inverted to give a thickness directly.
A separation s, a rib’s
width w, a sheet’s thickness t, and a rib’s height h are obtained from this
figure. The problem is, however, caused on the determination of s and w because
the intensity distribution is not rectangular but sine-like configuration.
These values can, however, be determined by the following two methods. One is
to find the position of an abrupt change of the transmitted light intensity.
That is, the width can be measured as a distance between the positions of an
abrupt decrease and the abrupt increase of the intensity due to a rib. The
other is to find out the position of the threshold light intensity; the space,
in which a light intensity is below the threshold level, is the rib's width. It
seems that the latter method is simple to use. However, it was found from the
experiments that the former method has three main advantages over the latter
method. Firstly, it is easy to find out the abrupt change of the light
intensity automatically by the use of software; on the contrary, it is
difficult to find out the threshold level automatically for all kinds of
polyethylene sheet. Secondly, the latter method involved an error due to the
large change of the base thickness; it was indistinguishable between ribs and
base, in other words, threshold level can not be determined. However, the
former method has no error due to such change. Finally, the width obtained by microscopic
observation agreed better to the one by the former method than that by the
latter method; the width obtained by the latter method was about 10 % smaller
than that by microscopic observation. Thus the former method was used in this
experiment.
The thickness of the
polyethylene sheet t, and the height of the rib h, can be determined by the
amount of the intensity decrease. Thus, all the information on the sheet can be
obtained automatically within 120 seconds.
Table 4.2 shows these
values obtained from figure 4.39. Each symbol of s1, s2,
h1, h2, w1 and w2 is expressed with
suffix number k, l, m and n which correspond to each dimension from left to
right as shown in Fig. 4.34.
Table 4.2
Results for the widths of polyethylene sheet and rib, W and w, the
thickness of polyethylene sheet t, the separation s, and the height of the rib
h, which are shown schematically in figure 4.34.
|
|
1 |
2 |
3 |
4 |
5 |
6 |
7 |
8 |
9 |
10 |
|
S1j |
1.61 |
1.57 |
1.66 |
1.56 |
4.81 |
4.58 |
1.61 |
1.60 |
1.63 |
1.56 |
|
S2j |
5.84 |
5.91 |
5.87 |
5.94 |
5.88 |
5.89 |
5.82 |
5.99 |
5.89 |
5.99 |
|
h1k |
0.13 |
0.12 |
0.12 |
0.15 |
0.16 |
0.14 |
0.13 |
0.12 |
0.11 |
0.11 |
|
h2l |
0.48 |
0.48 |
0.48 |
0.47 |
0.47 |
0.47 |
0.47 |
0.47 |
0.47 |
0.46 |
|
w1m |
0.30 |
0.26 |
0.26 |
0.36 |
0.42 |
0.30 |
0.30 |
0.34 |
0.26 |
0.30 |
|
w2n |
0.72 |
0.62 |
0.70 |
0.62 |
0.70 |
0.62 |
0.72 |
0.66 |
0.68 |
0.62 |
|
|
|
|
|
|
|
|
|
|
|
|
|
|
11 |
12 |
13 |
14 |
15 |
|
|
|
|
|
|
S2j |
5.96 |
5.86 |
5.87 |
5.94 |
|
|
|
t=0.32
(mm) |
||
|
h2l |
0.47 |
0.47 |
0.48 |
0.47 |
0.46 |
(mm) |
W=115
(mm) |
|||
|
w2n |
0.56 |
0.72 |
0.62 |
0.52 |
0.52 |
|
|
|
|
|
In conclusions, the
following results were obtained.
(1) The
system consists of a sensor head including laser and silicon photo diode, a
scanning system of the laser head, and a data processing system.
(2) The precision of the measurement is about 1/100 mm
and the time required for the measurement is about 120 seconds. The
system has already been placed in operation in a manufacturing plant.
4.6 Weight Density Sensor for Glass Wool Pipe
4.6.1 Introduction
The glass wool and fiber
have recently seen widespread applications. They are dust-proof papers in
semiconductor factories, separators to insulate electric current in batteries,
heat- and sound-resisting mats employed in automobiles and buildings. The
efficiency of the finished goods depends mainly on the uniformity of weight
density of raw glass wool when it is used in mats, fiber diameter when it is
used in filters, and thickness when it is used in pipes. We have developed an
optical system for monitoring the weight density of raw glass wool 18,19)
and the thickness of a semi-transparent foam sheet11,13) by passing
light through them. Further, we have developed a system for measuring the mean
diameter of optical fiber by reflected light20,21). A light
interacting with the measured object can be used directly in all these methods
since the objects are semi-transparent and roughly constitute a flat plane.
Another example of glass
wool application will be a pipe for protecting against heat and cold of a metal
pipe through which water, steam and other fluids flow. The deviation of the
pipe's thickness, i.e., an eccentricity, will be most important for a practical
use. The eccentricity has hitherto been measured by CCD camera. This method has
two distinct disadvantages. Firstly, it can only measure eccentricity at the
edge and not at the center region of the pipes. Secondly, measurement errors
are produced by a lack of clarity due to broken pieces of the glass wool. The
technique in this paper for measuring eccentricity of glass wool pipe is simple
and efficient, and further it does not possess the disadvantages inherent with
CCD camera method.
In this section, a
practical system for detecting the eccentricity of a glass wool pipe has been
developed optically by a hybrid method. The thickness of the pipe is measured
by the contact method and the displacement of a contact head is measured by an
optical method.
4.6.2 Principle and Method
Figure 4.40 shows the
photographs of the glass wool pipe and Fig. 4.41 the schema of the pipe's cross
section. The pipe usually has an eccentricity, i.e., a deviation of the
thickness. This caused a serious problem at a junction when it was used to cover
the iron pipe in practice. An unacceptable pipe having too large an
eccentricity should then be rejected. The
eccentricity
of the glass wool pipe can, usually, be defined as,
|
|
(4.23) |
where
tmax is the maximum thickness of the glass wool pipe, tmin
the minimum thickness and ta the mean thickness, or defined
thickness. By the method described in this paper, the eccentricity can be
measured in all directions as the pipe rotates in a 360![]() arc, i.e., 1 cycle.
arc, i.e., 1 cycle.
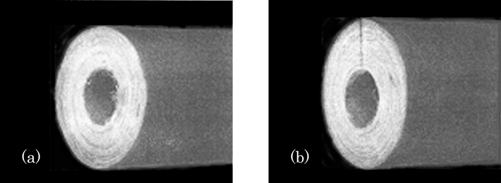
Fig. 4.40 Photographs of physical glass wool pipe, (a)
without a cut, and (b) with a cut.
Fig. 4.41 Definition
of eccentricity.
The cross section of the
glass wool pipe was usually unclear due to the chips in cutting. Further, the
pipe itself was too soft for the thickness to be accurately measured. These
make the CCD camera method difficult. It is thus necessary to use the contact
method by loading a constant pressure on the surface for an accurate
measurement of the pipe's thickness. For this purpose we developed a hybrid
sensor system consisting of two sensor heads; a contact head and a light head.
Figure 4.42 shows the
hybrid sensor system. Figure 4.42(a) shows a whole view of the system and Fig.
4.42(b) an enlarged view of the sensor. Both ends of the glass wool pipe are
held on the pipe support. The contact head with a rotator is placed on the pipe
as shown in Fig. 4.42 and imposes a constant pressure on the pipe, which
enables an accurate
Fig. 4.42
Schema of the hybrid sensor system consisting of two sensor heads; (a)
whole view of the sensor system, and (b) an enlarged view of the contact and
optical heads.
measurement.
The measurement can be done at any position in the axial direction of the pipe.
The CCD camera method can only measure the eccentricity of the cross section at
the end. As the pipe rotates, the contact head will be displaced up and down
according to the thickness of the glass wool pipe. A sheet-like laser light was
used to measure the displacement of the contact head. That is, the light sensor
can accurately detect the displacement since the light intensity is in
proportion to the pipe's thickness. The dusts on a laser and a photo receiver
cause a measurement error when the system is used in a practical plant. The problem
will be solved by using the windows on them and by wiping off the dusts
periodically. Another solution for the problem will be to normalize the light
intensity through the gap in each measurement by the light intensity through a
constant gap.
In practical
applications, pipes having too large an eccentricity should be removed. Figure
4.43 shows an electronic circuit for this purpose. An analog signal for the
thickness will be obtained on the amplifier, as shown in a cut. A signal for
the quality can, finally, be obtained by this logic circuit. That is, the
signal for the inferior goods, i.e., the pipe having lager eccentricity than
the pre-defined one, en, is expressed by "NG" and the one
for superior goods by "OK". The signal of "NG" is obtained
if the analog signal at any time during a rotational cycle only exceeds the
range between VH and VL, both of which are determined by
en. The logic circuit is reset in every rotational cycle and the
next reading starts. The value of en is usually 10~20%, which is
determined according to the mean thickness of the pipe.
Only the signals of
"NG" and "OK" will be required for the practical
applications. The analog signal for all the directions, i.e., over a 360![]() arc, will, however, be shown in this paper to examine the
eccentricity in detail.
arc, will, however, be shown in this paper to examine the
eccentricity in detail.
Fig. 4.43 Electronic circuit to measure the
thickness of the glass wool pipe without a straight
cut for
judging its quality as acceptable or unacceptable.
4.6.3 Results and Discussions
Preliminary experiments
were carried out using pipes without a cut. Fig. 4.44(a) shows a representative
result for a pipe with small eccentricity i.e., for superior quality, and (b)
with
Fig. 4.44 Thickness of the glass wool pipe
without straight cut: (a) with small eccentricity, and (b) with large
eccentricity.
large
eccentricity i.e., for inferior goods. T shows a period for 1 cycle and was
about 1.6 second in all the experiments. In this case, the pre-defined
eccentricity was en=0.13.
The glass wool pipe is
usually 1~2m in length and should be cut in that direction when it is used for
covering iron pipe, vinyl pipe and other types. In practical applications, it
is difficult to measure pipe thickness previous to cutting.
Figure 4.45 shows the
result for a pipe with the cut which is practically applied. A decrease in pipe
thickness occurs suddenly at the edge of the cut as shown in this figure, and
this will cause an error when judging for superior or inferior quality. A
misjudgment occurs only at the thin region as shown in figure 4.45(b) and does
not occur at the thick region as shown in figure 4.45(a).
The degree of
misjudgment was, however, negligibly small in the context of practical use when
the open area of the cut was rather small. When the open area was larger than
about 20![]() arc, a misjudgment arose. This problem can, however, be
solved by using another photo light sensor to detect the cut.
arc, a misjudgment arose. This problem can, however, be
solved by using another photo light sensor to detect the cut.
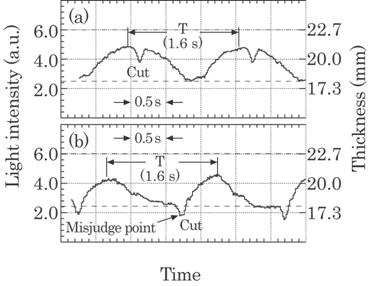
Fig. 4.45 Thickness of the glass wool pipe with
a cut: (a) the cut exists at a thick region, and (b) the cut exists at a thin
region, which yields misjudgment.
Figure 4.46 shows an
electronic circuit designed for this purpose. The sensor signal to detect the
cut, E2, can successfully be used to suppress the sudden change of E1
at the cut by means of the sample holding circuit. Then, the logic circuit will
accurately judge the quality of the goods. That is, the circuit will display
"NG" when the eccentricity is over the defined one, en,
and "OK" when it is smaller than en.
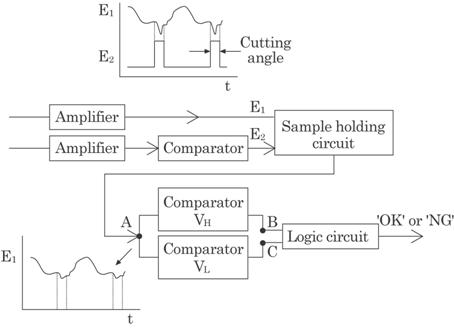
Fig. 4.46 Electronic circuit with a sample
holding circuit to compensate an error due to the straight cut. Connections A,
B, and C in this circuit correspond to A, B, and C in Fig. 4.43.
Figure 4.47 shows the
result obtained by this sample holding circuit. The sudden change in thickness
at the cut has been kept at a constant value and thus the circuit in figure
4.46 will make an accurate judgment for practical use.
Fig. 4.47 Suppression of the sudden decrease in
thickness at the cut by using the sample holding circuit shown in Fig. 4.46.
The time for a
rotational cycle, i.e., period T, was about 1.6 second in this experiment. The
minimum time necessary for the measurement was, practically, about 1 s; when
the minimum time was shorter than 1 s, the contact head vibrated as the glass
wool pipe rotated and misjudgment occurred. However, eccentricity measurements
may be achieved at higher pipe rotational speed if the dynamic responses of the
contact head and glass wool pipe are understood. The time of 1 s, was, however,
short enough in the practical application.
Thus, the signal
processing system allows implementation of on-line process monitoring and alarm
warning signals for unacceptable pipe eccentricity during manufacturing.
In conclusions, the
following results were obtained.
(1) A
practical system for measurement of the thickness of glass wool pipes has been
developed by using a hybrid sensor system consisting of a contact sensor and an
optical sensor.
(2) The
sensor system has two main merits in its high accuracy and high speed, and in
its simplicity of construction. The system has now been successfully applied to
a practical situation.
[Chapter 5
will be presented in the upcoming July-August 2010 issue of this Journal.]
References
1)
for examples (all patents are in
A Patent Journals No.
27488(1979)," Blood Leakage Detection System by Using a Phototube",
No. 15163(1981)," Blood Leakage Detection Sensor for the Dialyzer", No. 11864(1984)," Blood Leakage Detection
Device", No.
26415(1987)," Blood Leakage Detection Device", and No.
22892(1990)," Method for the Blood Leakage Detection and It's
Apparatus".
2) A
patent journals No. 18664(1984),"Blood Leakage Detection Device" and
No. 39698," Detection Apparatus for a Small Amount of Blood Leakage".
3) L.
Reynolds, C. Johnson and A. Ishimaru, " Diffuse reflectance from a finite
blood medium: Applications to the modeling of fiber optics catheters",
Appl. Opt., 15-9(l976) pp. 2059-2067.
4) C. C.
Johnson, "Optical diffusion in blood", IEEE Trans. Bio-Med.
5) T.
Takou, J. Tsujiuti and S. Minami Eds., Handbook for Optical Measurements 6th
Ed., 1990, p. 672(in
6) H.
Tsuda: A streamlining production by realtime control of dye adsorption.
Industrial Technology, 29-7(1994) p.472.
7) M.
Ueda, S. Mizuno, & A. Matsumura, Realtime optical sensor for dye color and
concentration detection. Laser
8) R.
Kubo. & H. Takahashi, Ed. Encyclopedia for Physics and Chemistry, 3rd Ed.,
(1976, Iwanami) p. 1400.
9)
Y. Ichioka, et al. (eds), Optical sensor technology, Optronics (1990) (in
Japanese).
10) M.
Ueda, K. Ishikawa, J. Chen, S. Mizuno, and Y. Touma, "Highly sensitive
optical sensor system for blood leakage detection", Opt. Lasers Engng.,
21(1994) pp. 307-316.
11) M.
Ueda,
12) M.
Ueda, K. Ishikawa, J. Chen,
13)
M.Ueda, S.Mizuno, A.Matsumura and F.Tohjyo: Light attenuation in a
semitransparent foam sheet-thickness measurement for industrial use", Opt.
Lasers Eng. 24(1996) p. 339.
14)
Mitaka Kohki Inc., Catalogue No. NH-3(2000), Non-Contact 3-D Contour Meter.
15)
Hamamatsu Co. Ltd., Catalogue No. C6595(2000), Laser Microscopic Meter.
16) Sony Precision Technology Inc., Catalogue No.
YP10(2000), Non-Contact 3-D Measurement System.
17) M.
Ueda, T. Yamaguchi, J. Chen, K. Asada, K. Taniguchi, and H. Suga, Opt. Lasers
Engr. 32(2000) 21.
18) J.
Chen, M. Ueda, K. Asada, & K. Taniguchi, Realtime Densitometer for Glass
Wool Using Solar Cell. Opt. Lasers Engng. 29(1998) p. 61.
19) M.
Ueda, J. Chen, K. Taniguchi, & K. Asada, Realtime Weight Densitometer for
Glass Wool Using Solar Cell- for Industrial Use. Rev. Laser Engng. 26(1998) p.
328.
20) J.
Chen, Y-E. Lee, M. Ueda, K. Taniguchi, & K. Asada, A Simple Optical Method
for the Measurement of Glass Wool Fiber Diameter. Opt. Lasers Engng. 29(1998)
p. 67.
21) J.
Chen, Y-E. Lee, K. Taniguchi, K. Asada, & M. Ueda, Optical Method for
Measuring Mean Diameter of Glass Wool Fibers. Rev. Laser Engr. 26(1998) p. 176.
[ BWW Society Home Page ]
© 2009-2010 The Bibliotheque: World Wide Society